03. Research
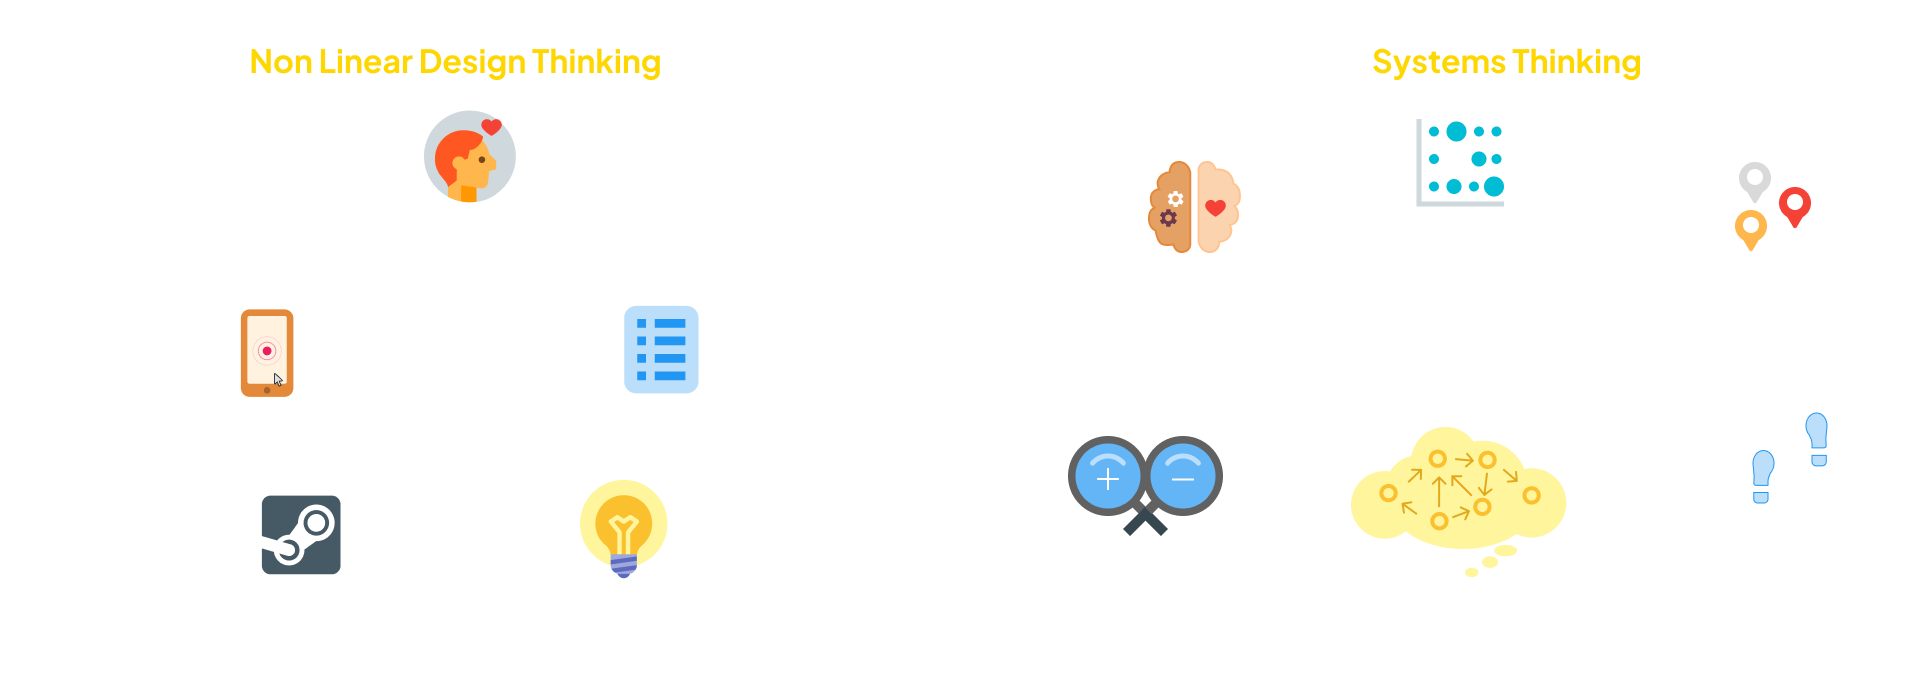
I had worked on the legacy LOS for nearly a year before this project started. Enough time to observe its failures directly — not from a brief, but from being inside it. When the merger created conditions for a new platform, that firsthand knowledge became the starting hypothesis. Research didn't create the problem list. It validated, deepened, and in several cases overturned it. The approach combined Non-Linear Design Thinking with Systems Thinking — looping between empathy, ideation, prototyping, and testing as findings demanded. What drove it was curiosity: every answer raised a new question, and following those questions back and forth between departments revealed how each team's behaviour was shaped by — and in turn shaped — every other.
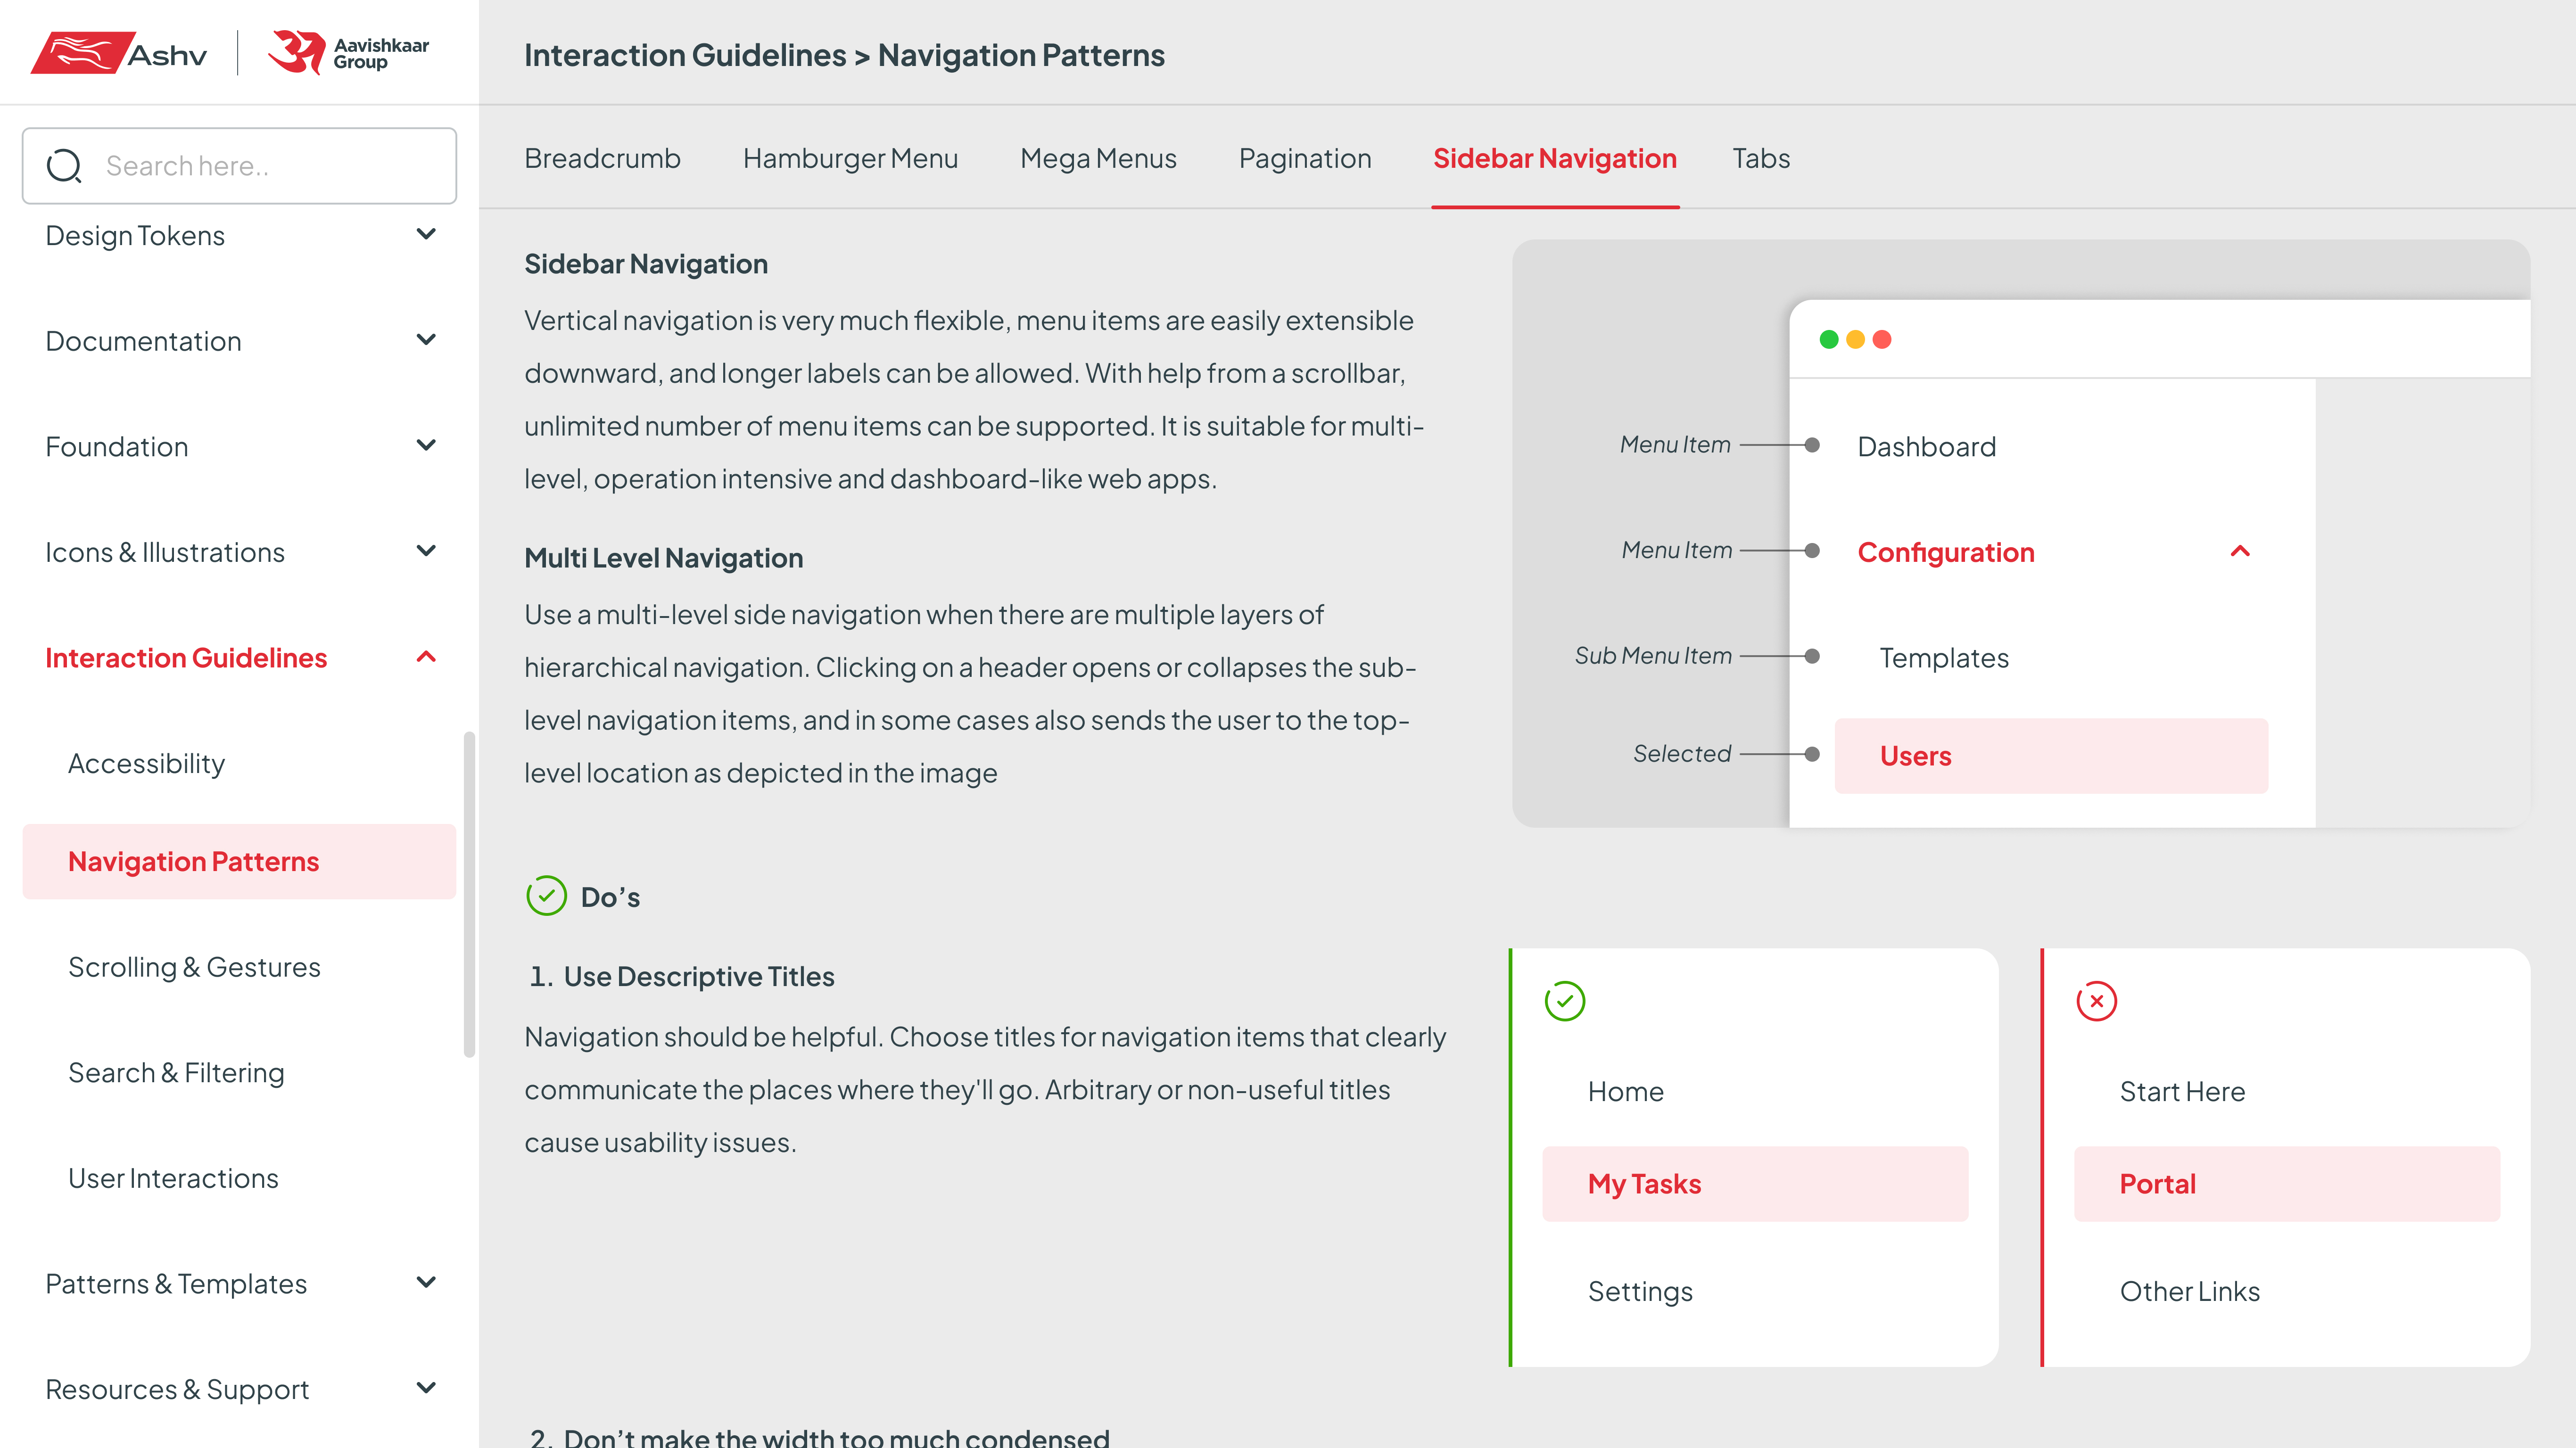
3.1 — Heuristic Evaluation
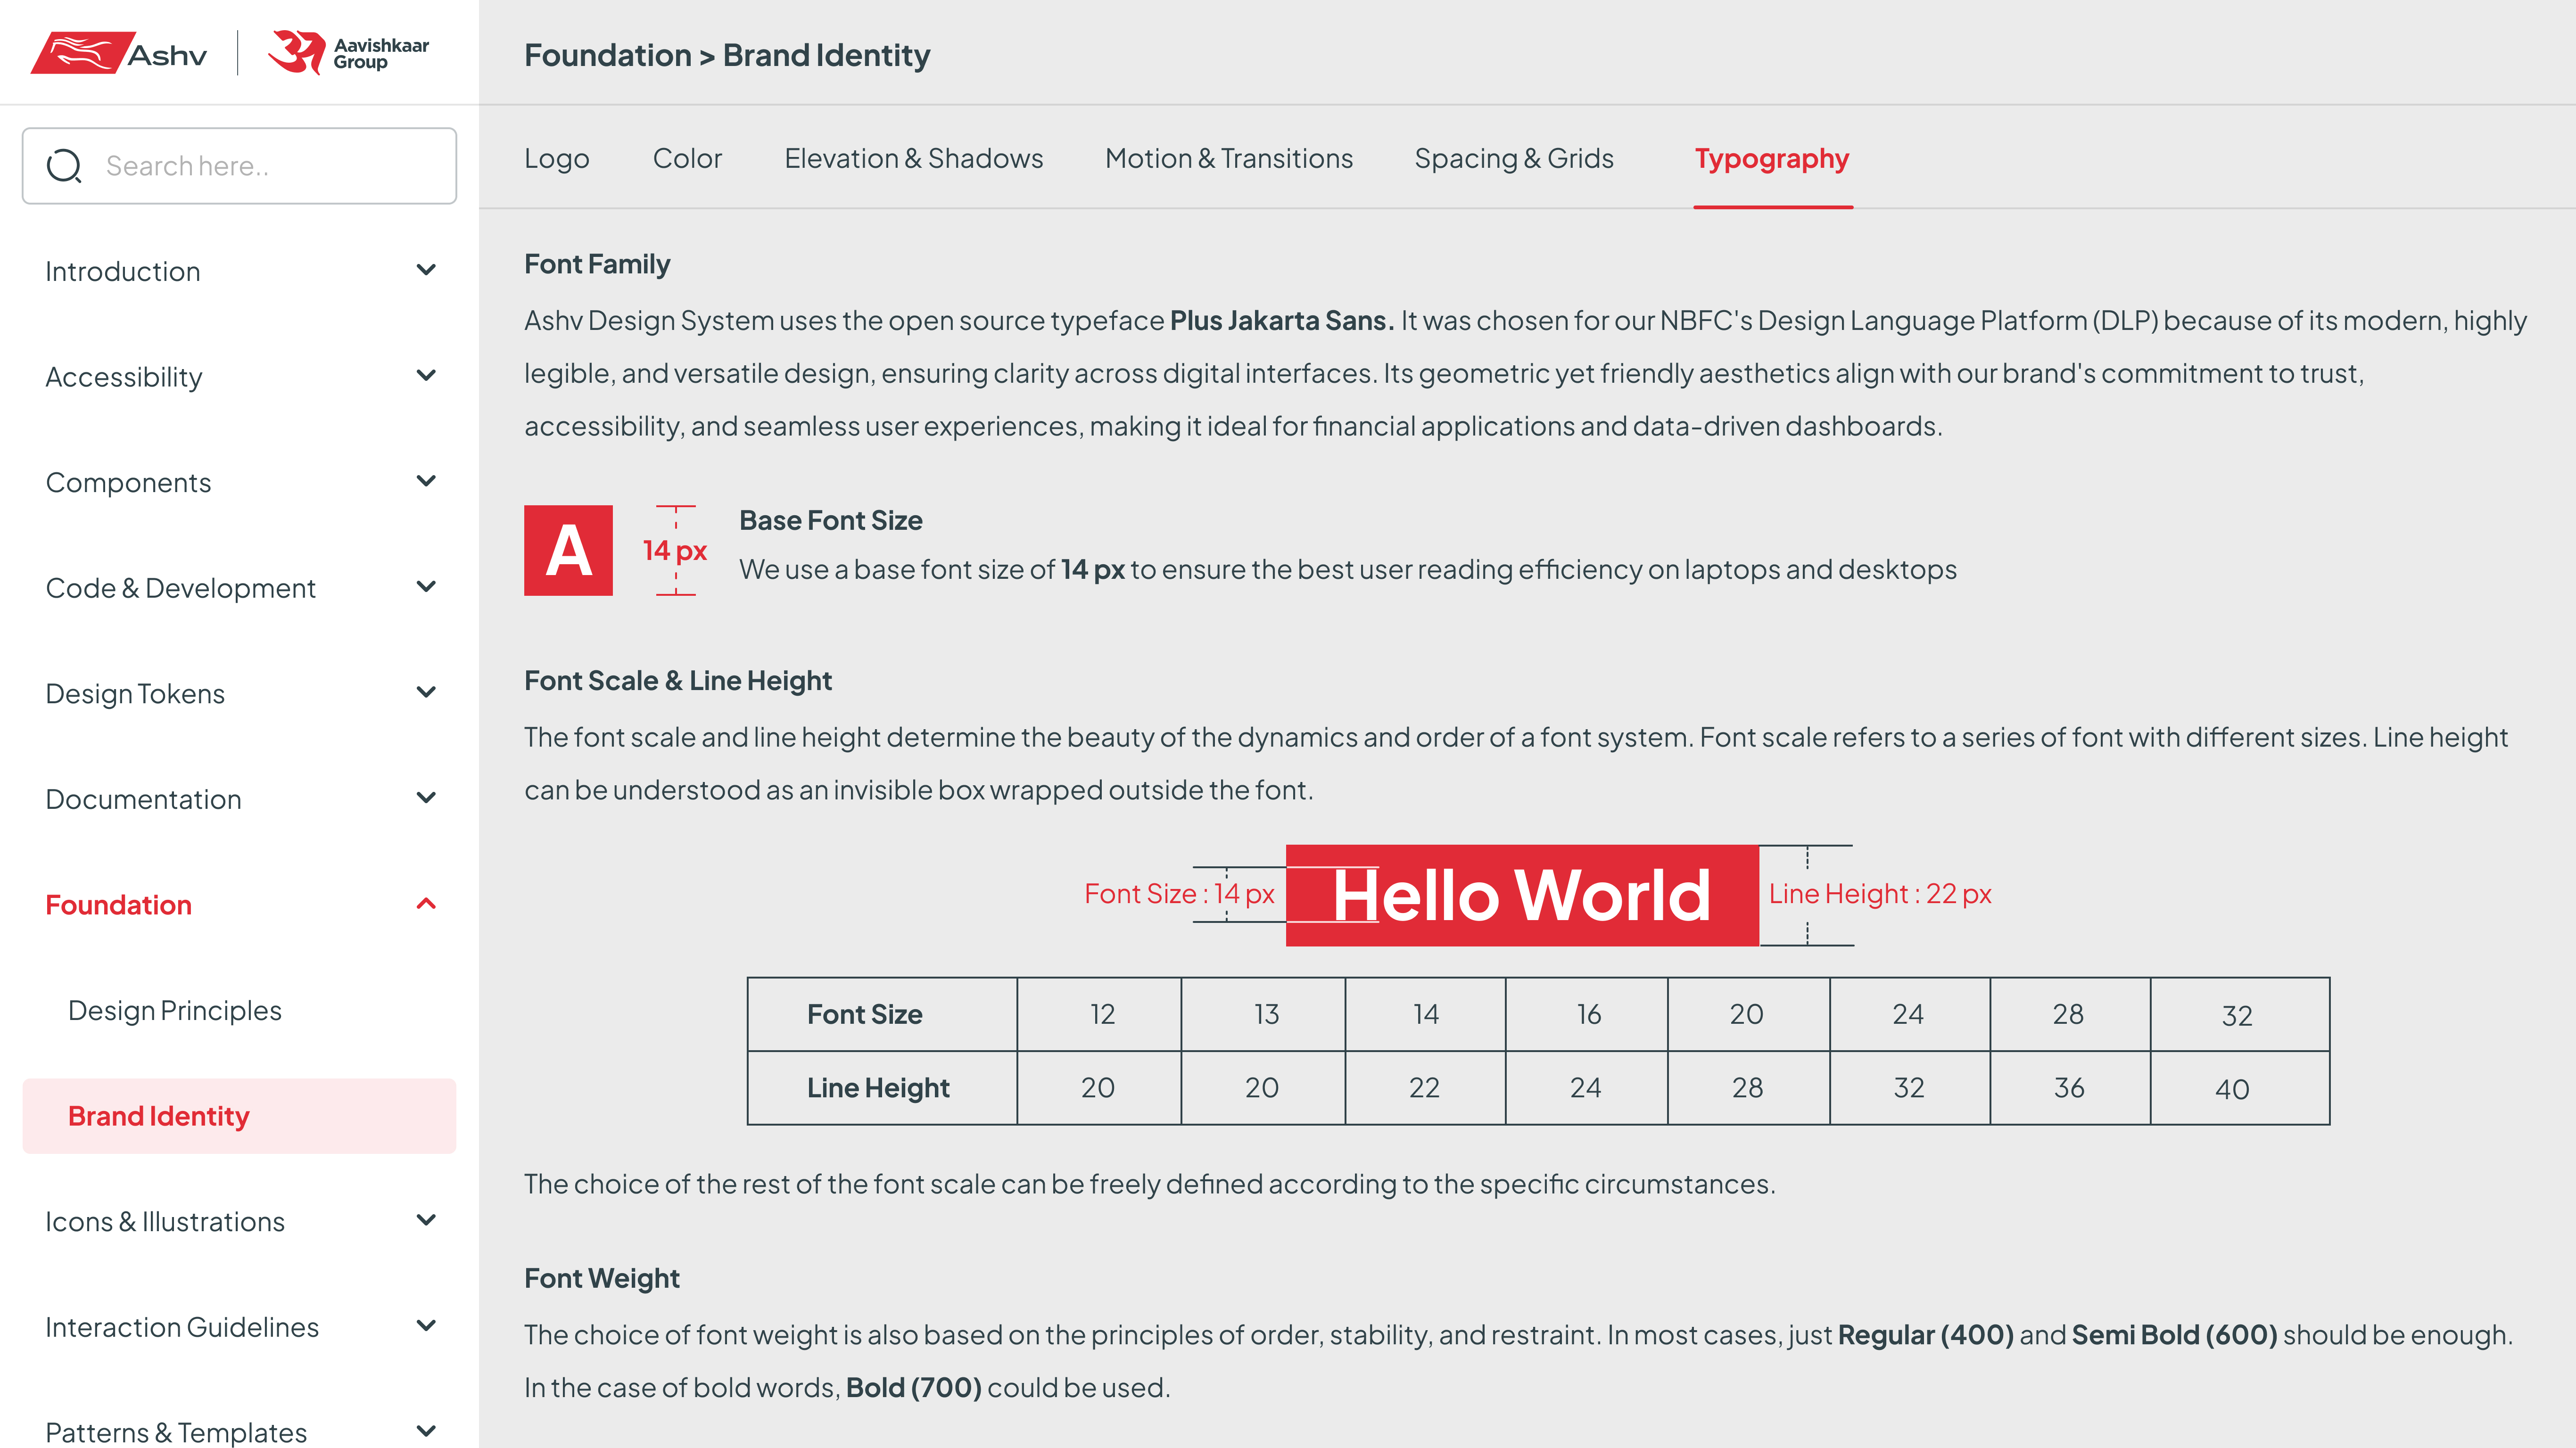
The findings gave us named, principle-grounded evidence to anchor every design system decision.
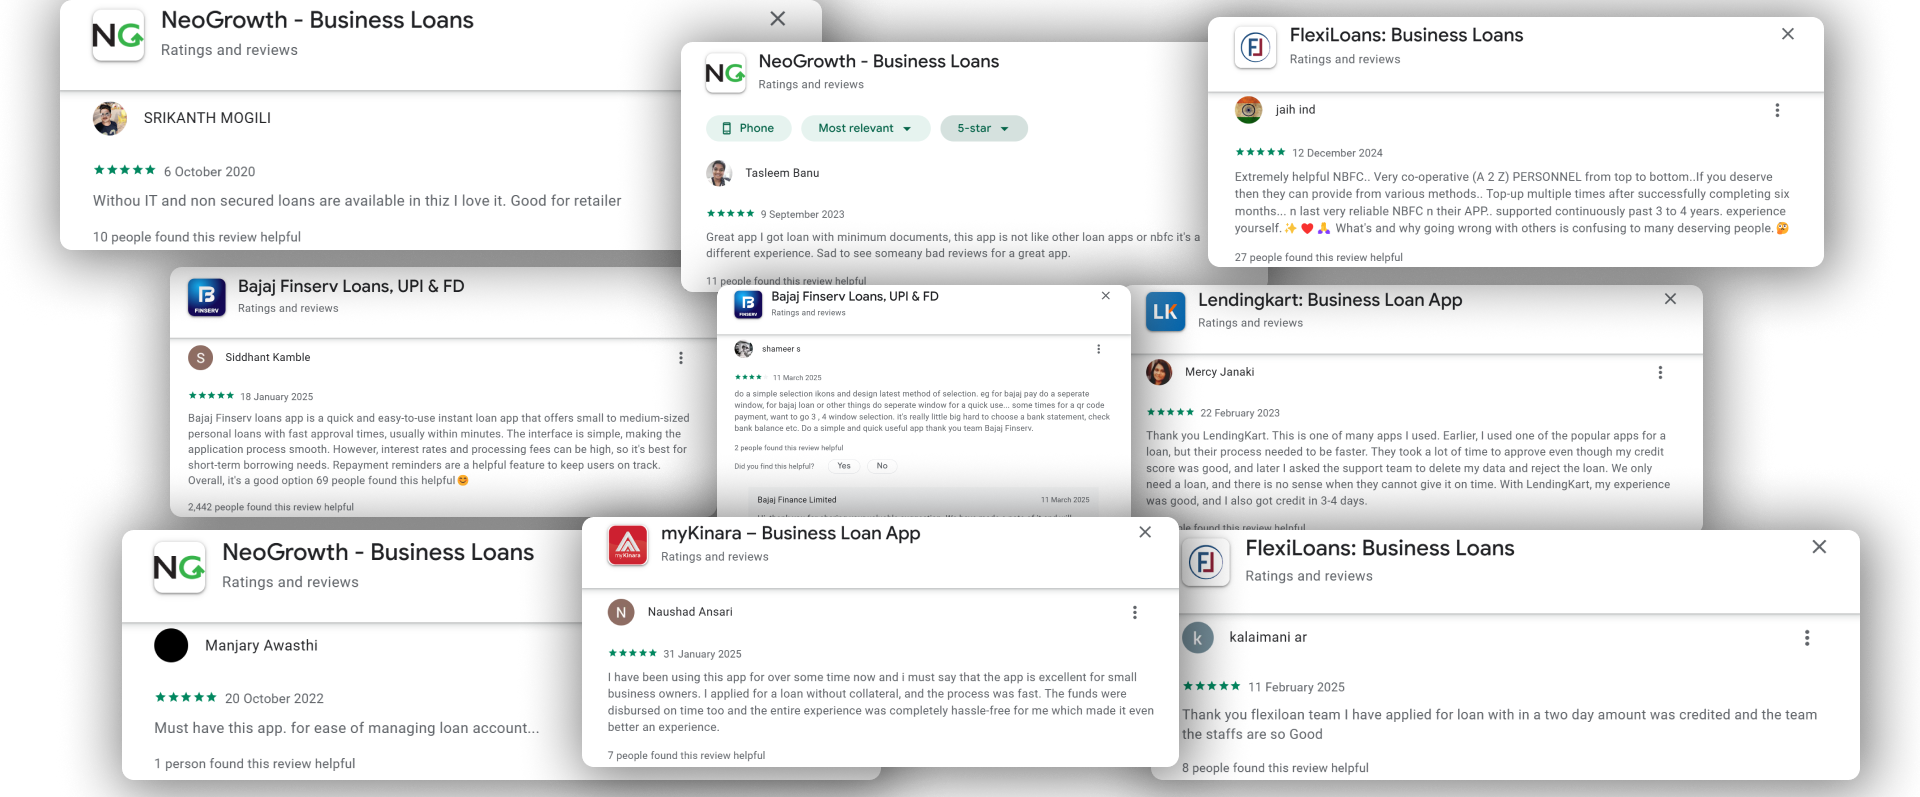
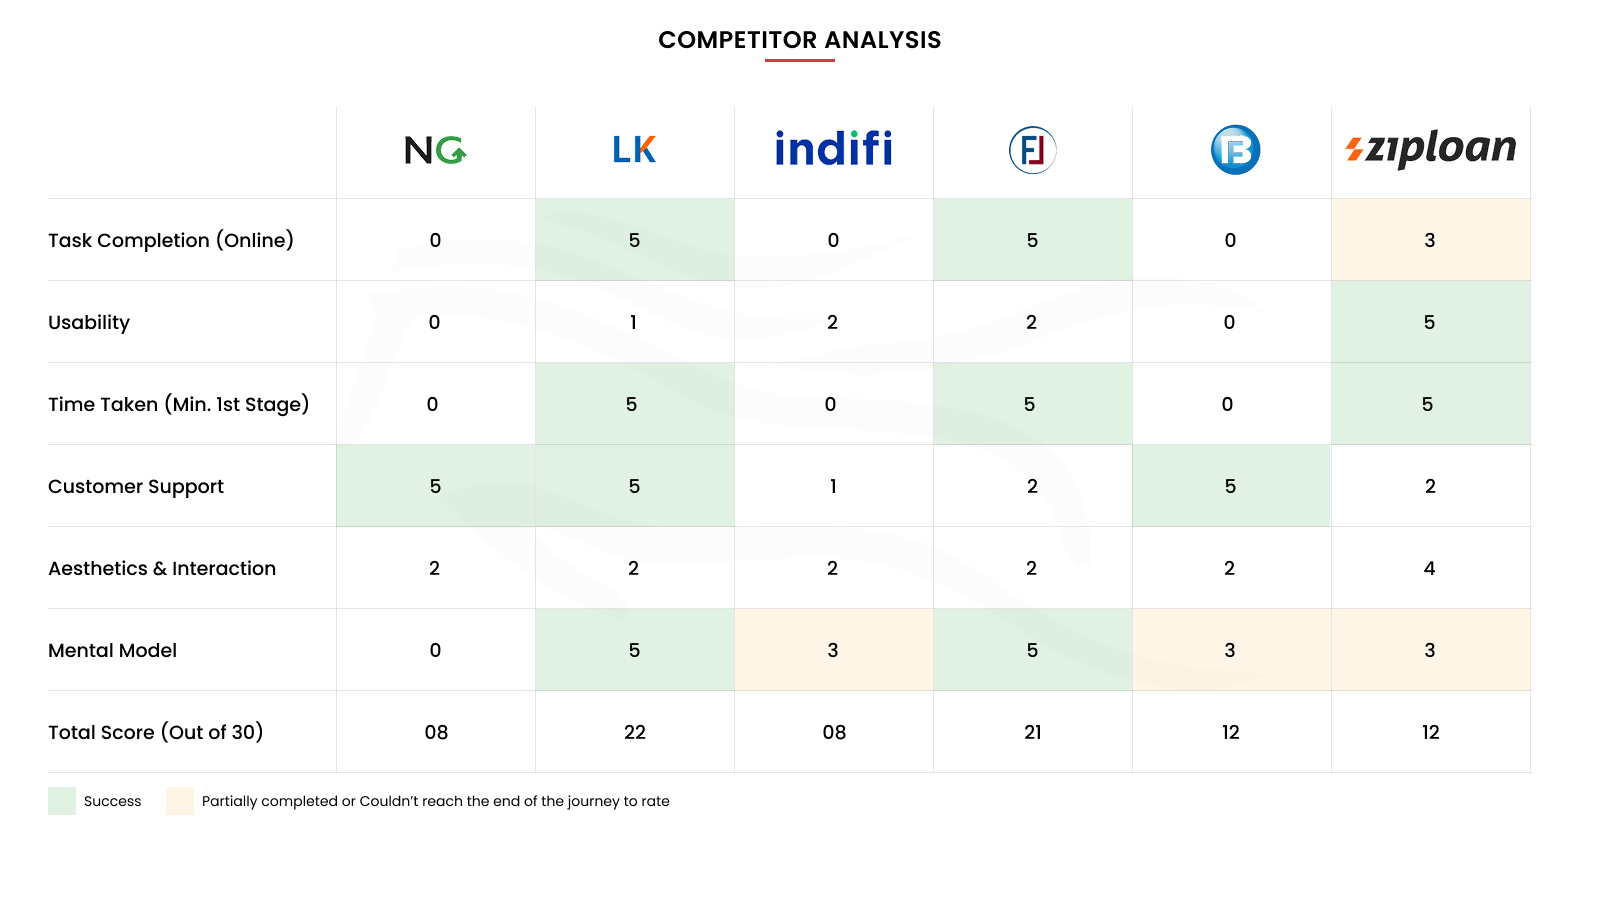
3.2 — Competitor Reviews & Walkthroughs

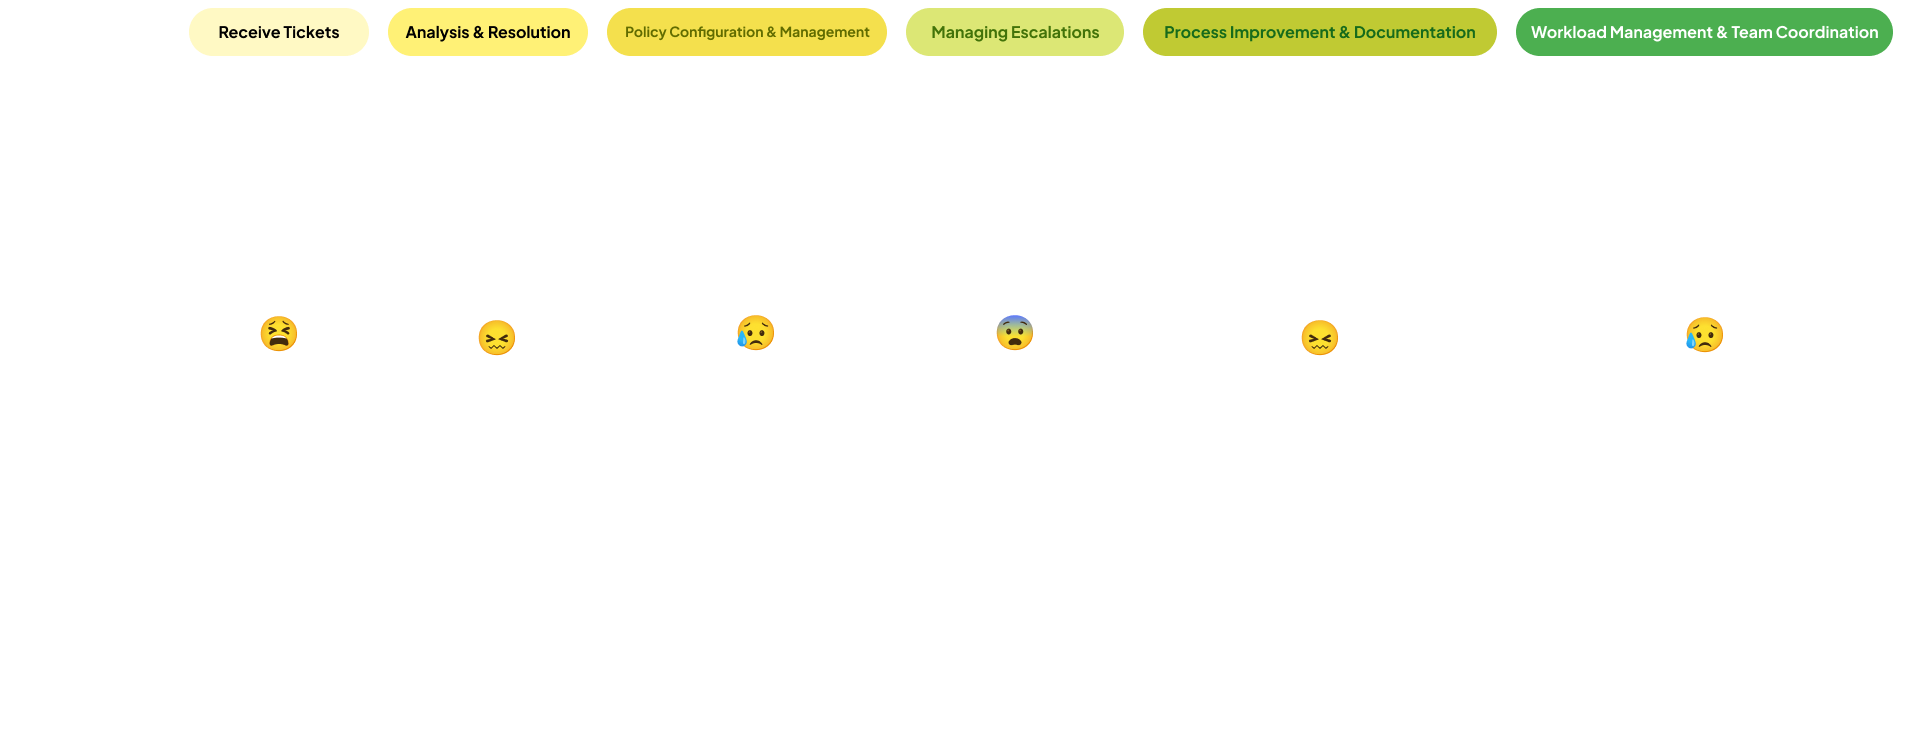
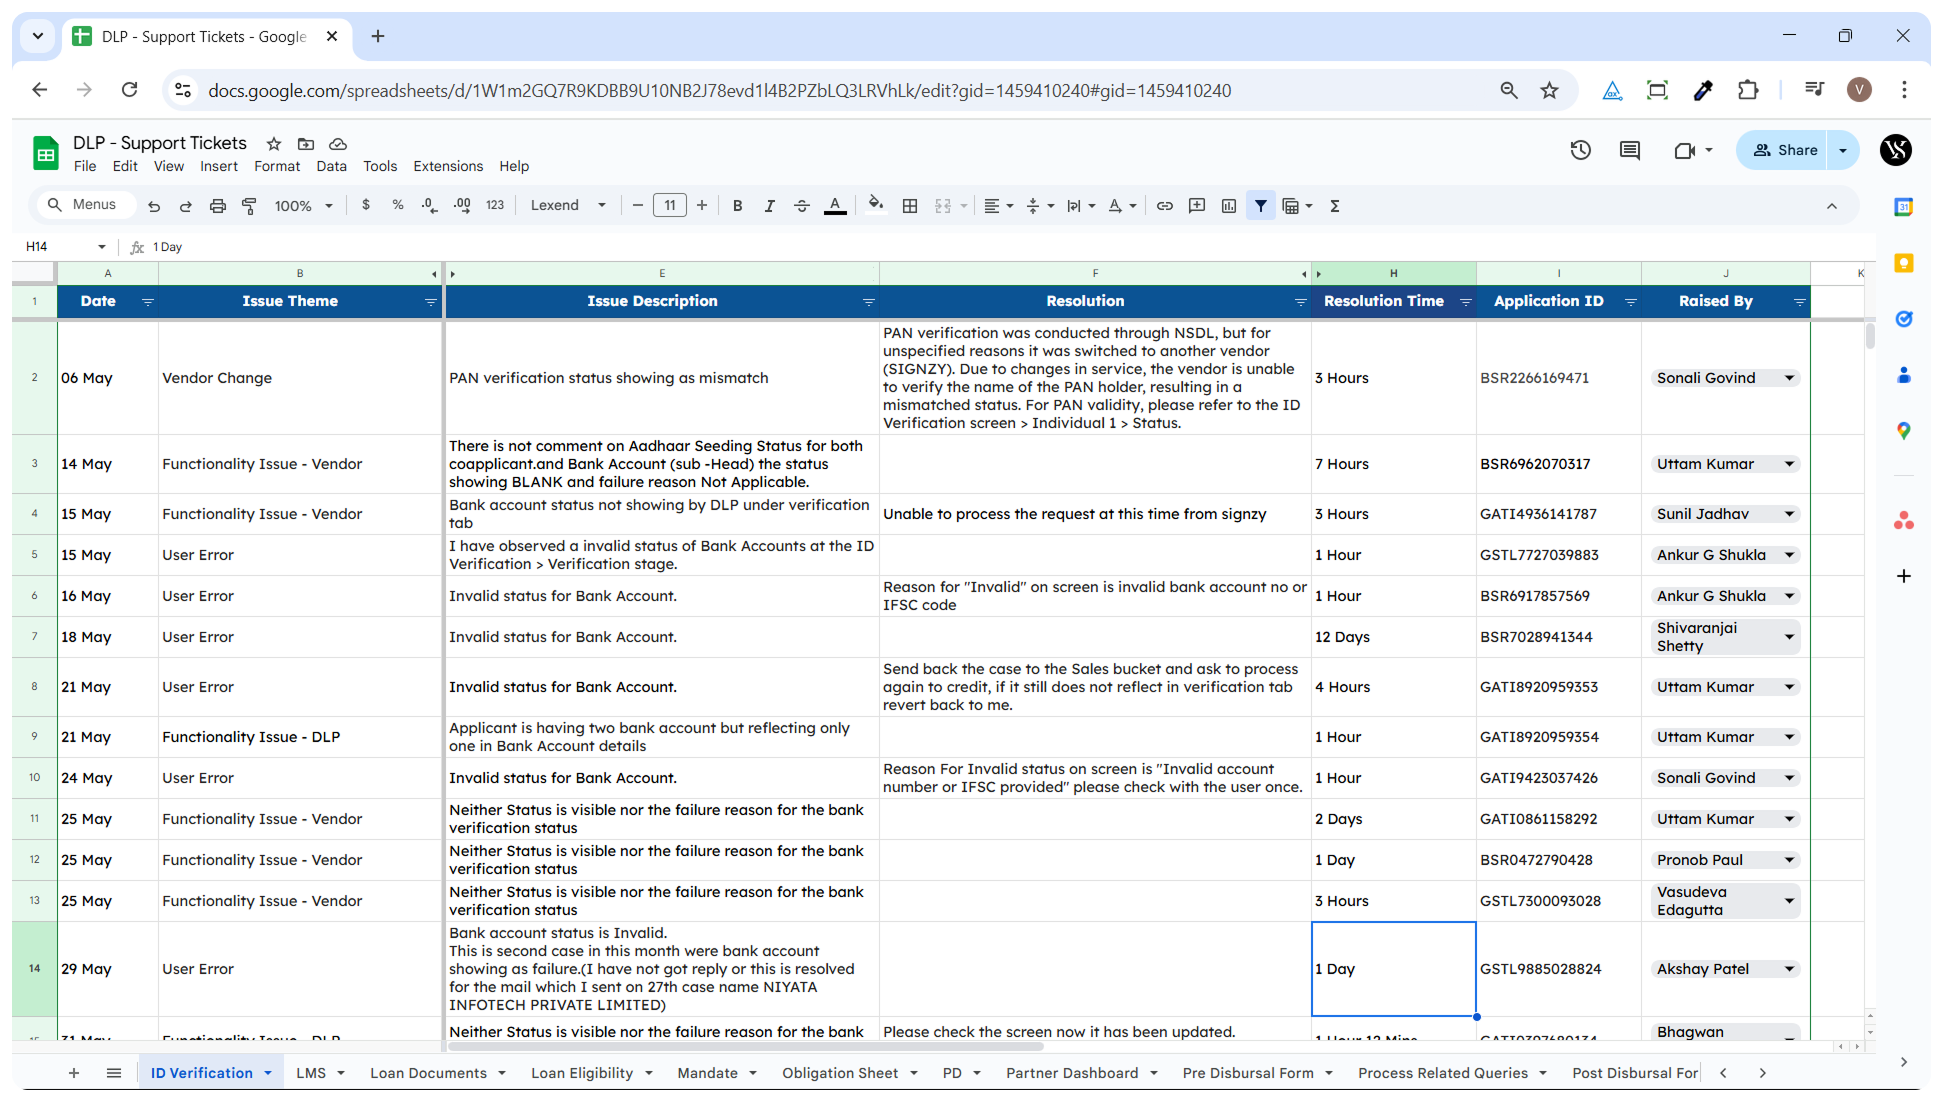
3.3 — Support Ticket Analysis
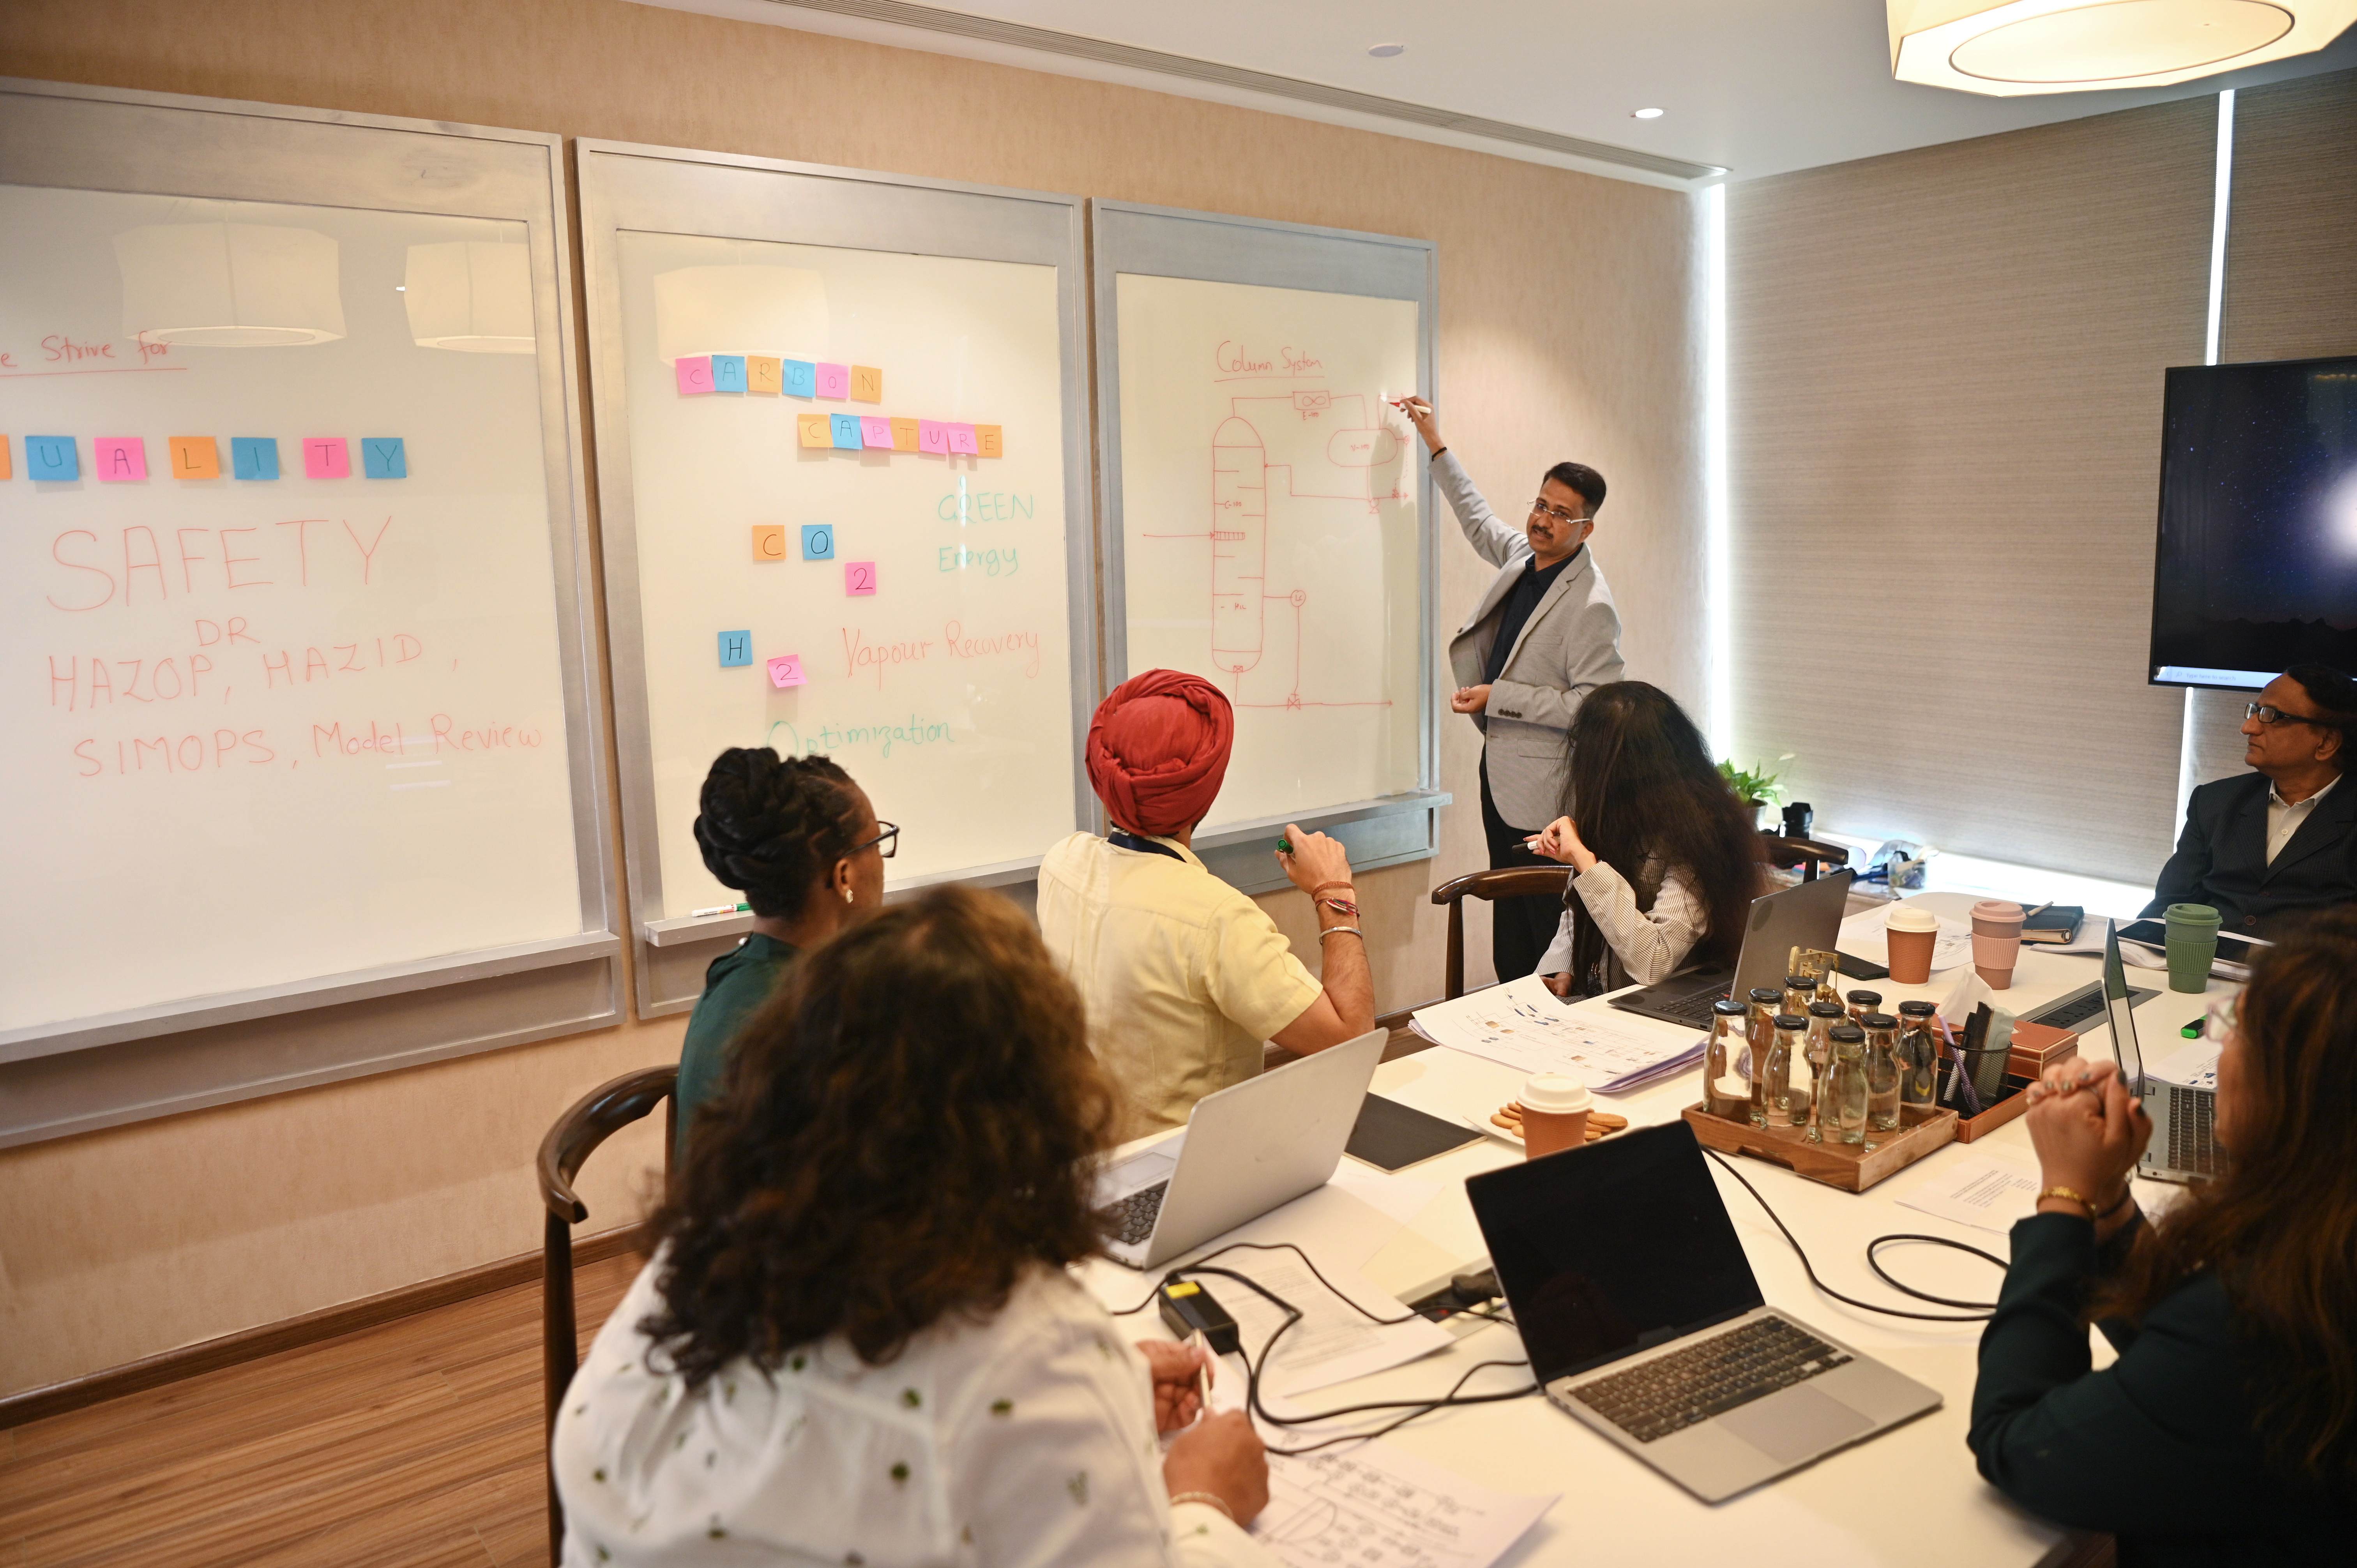
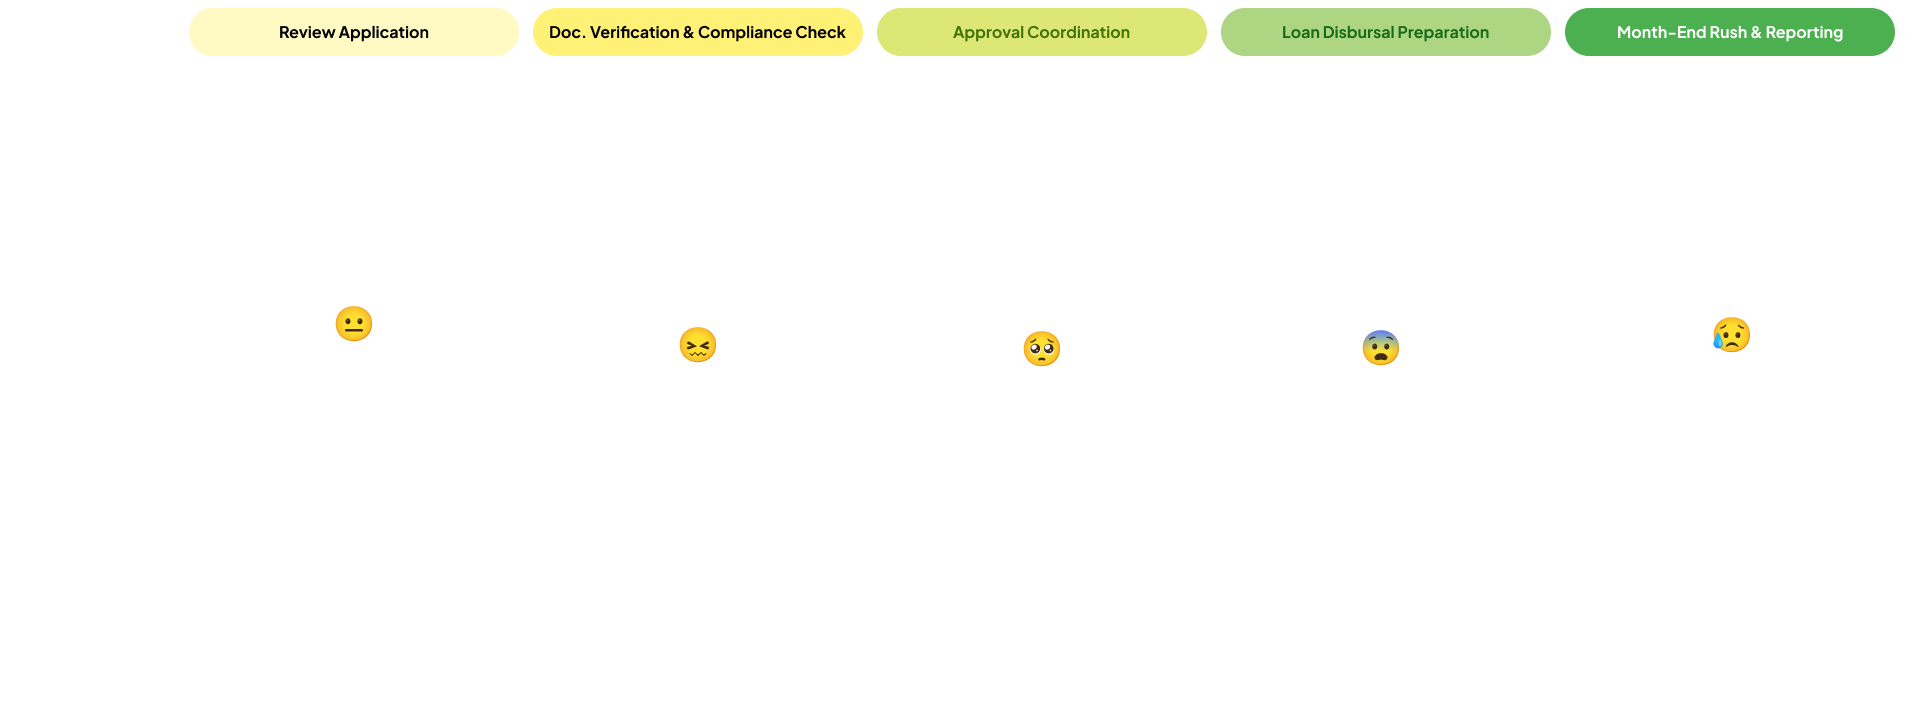
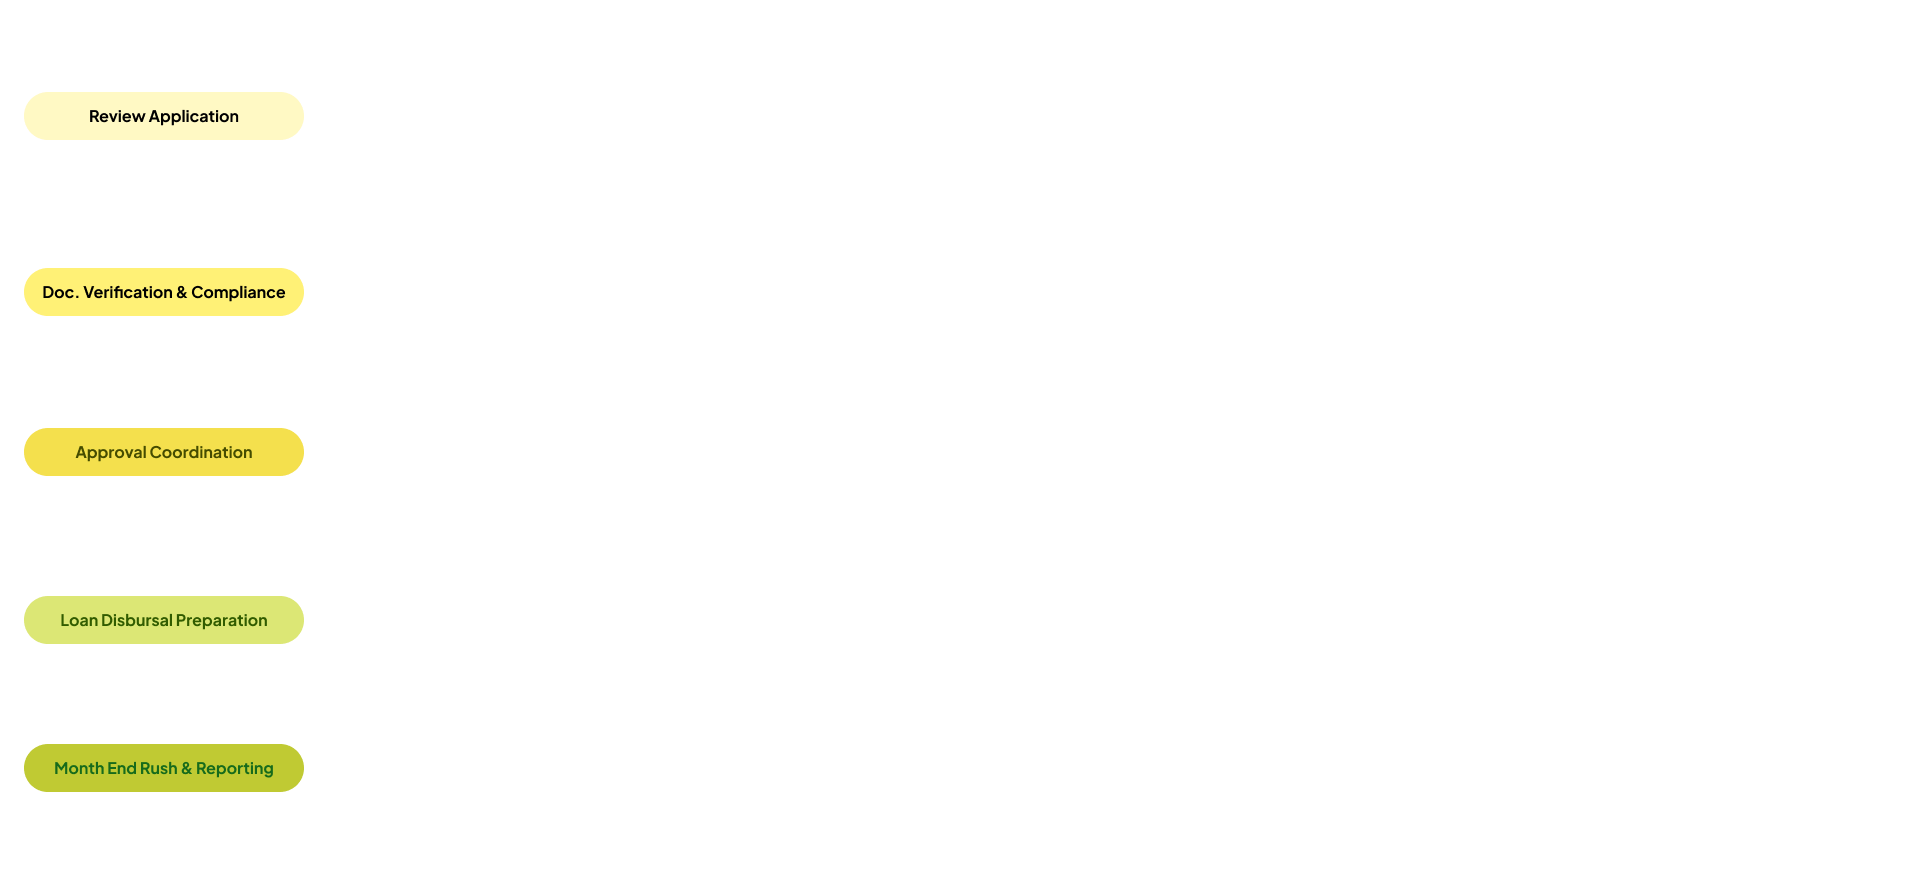
3.4 — Ethnographic Research: Apprenticeship Model
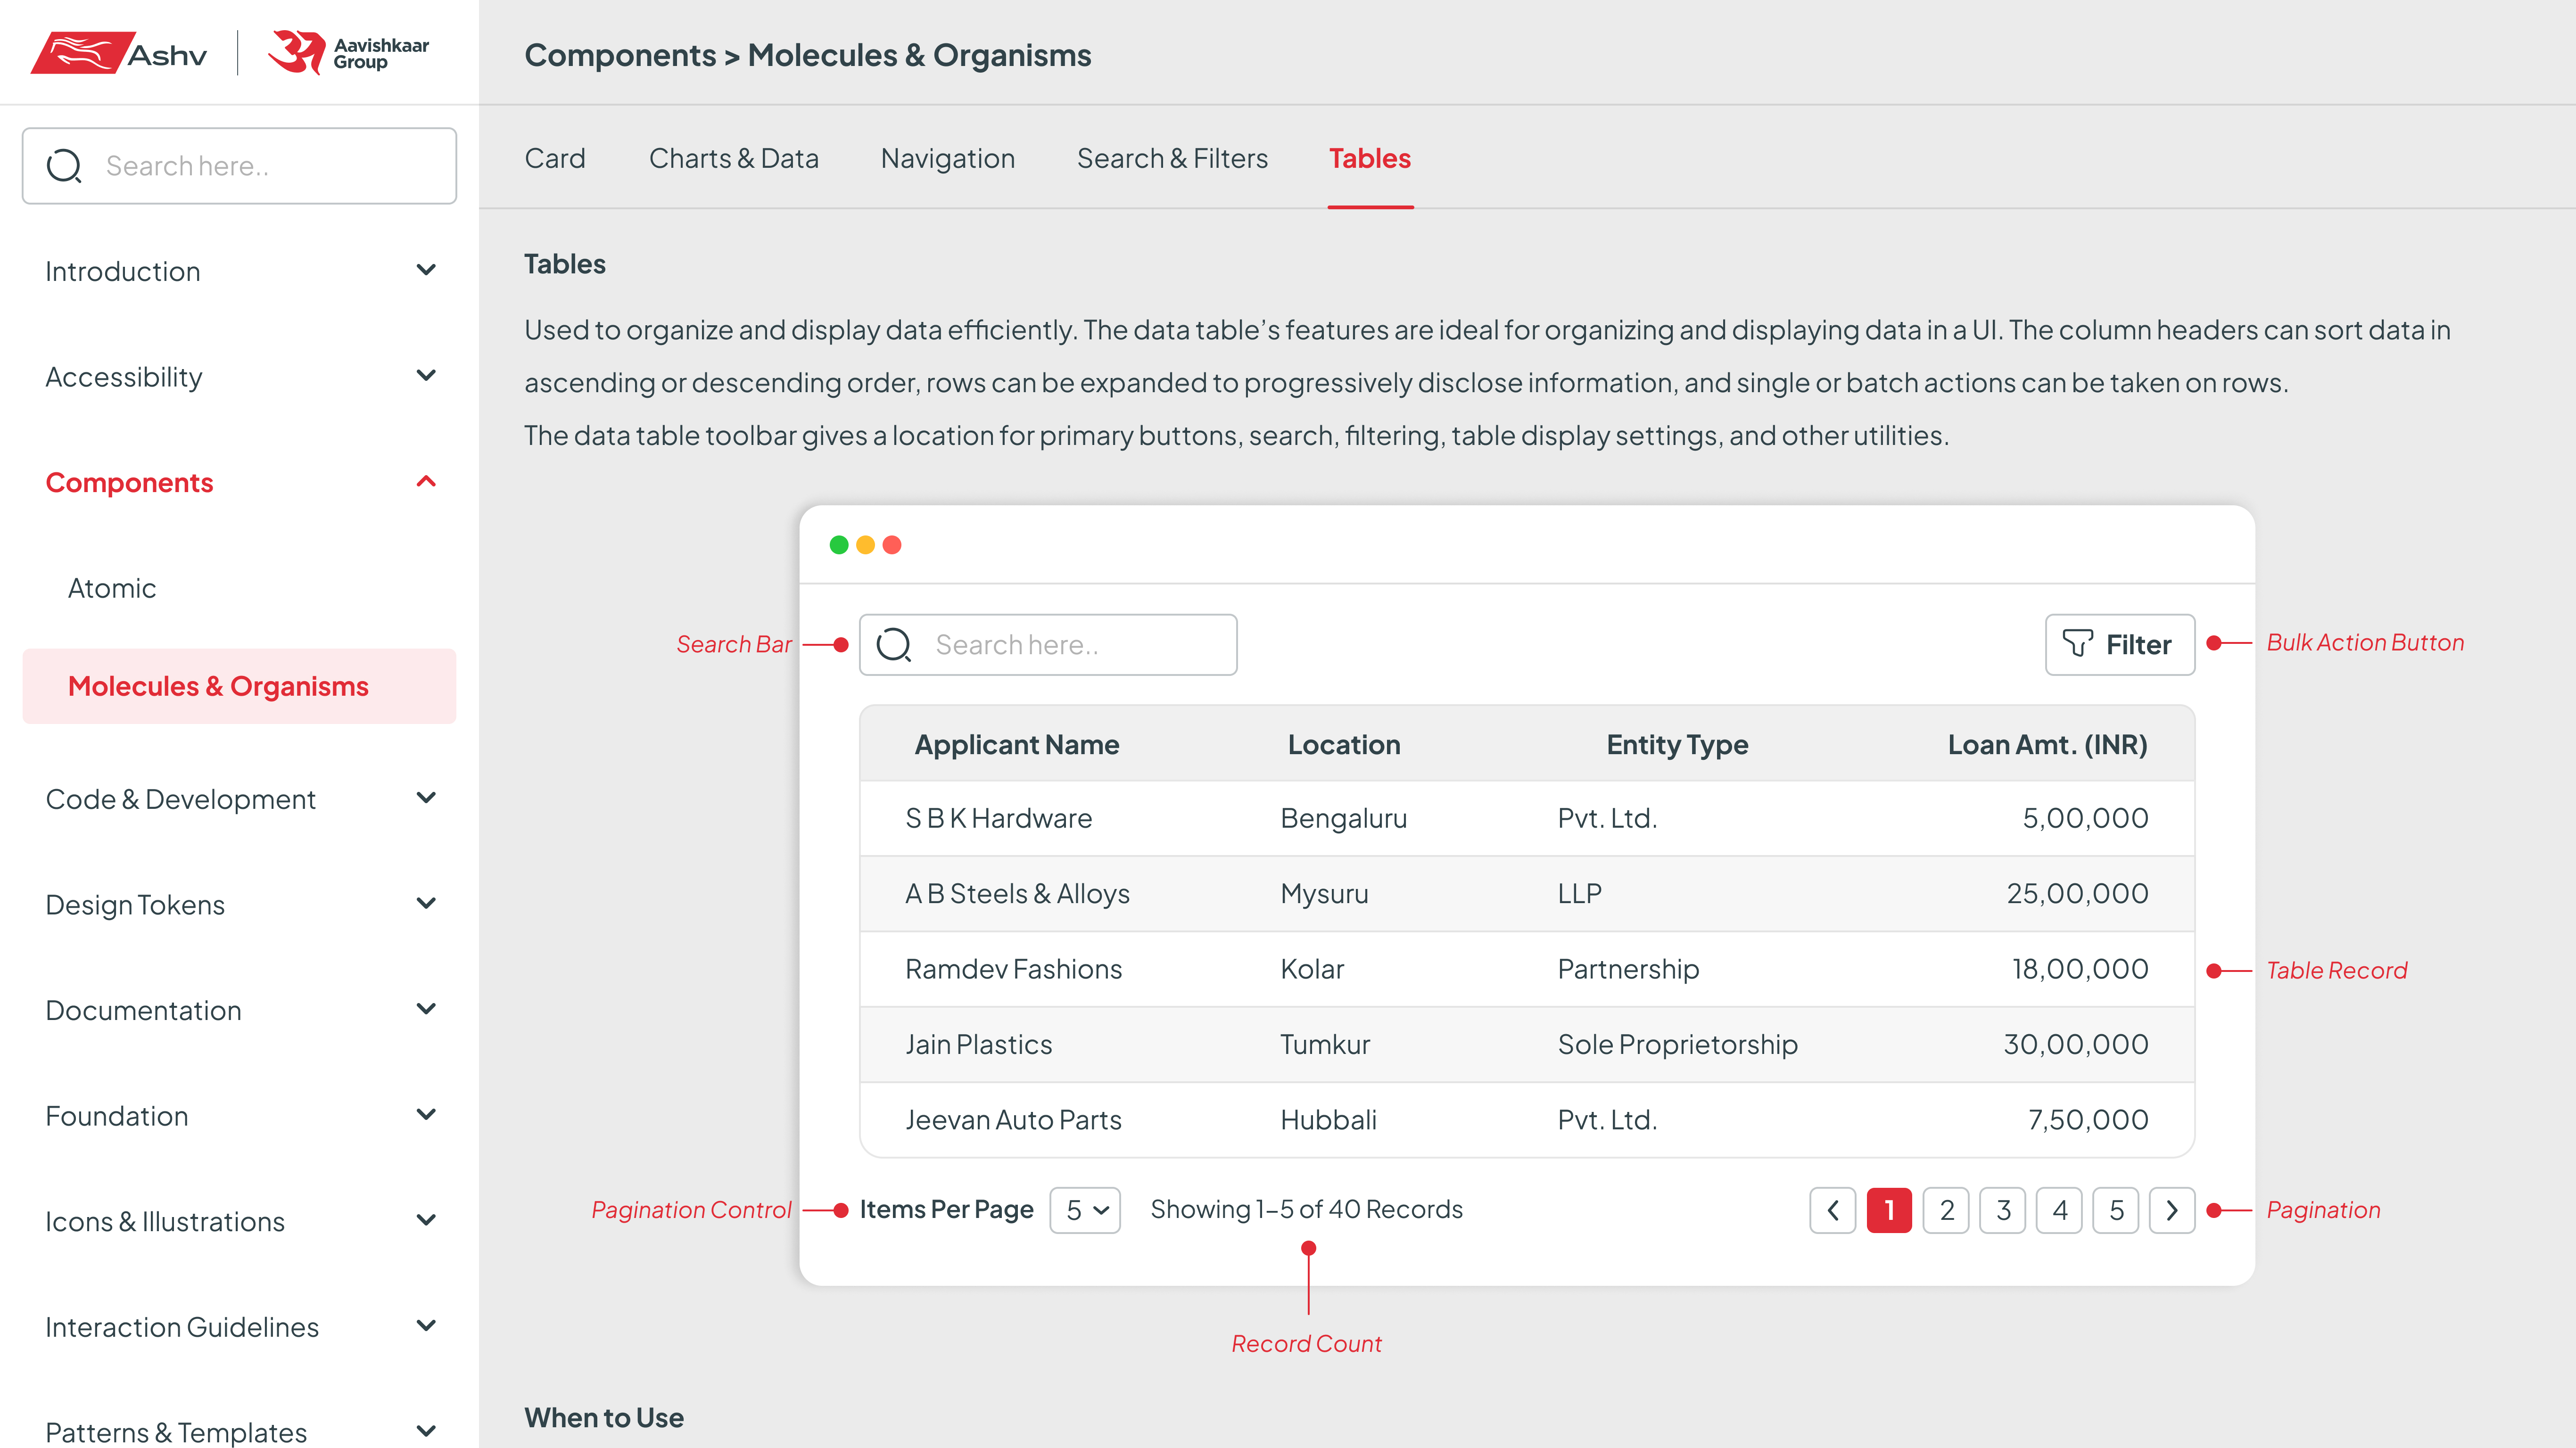
- CMs doing transaction tagging and obligation sheet work entirely in Excel — the LOS lacked sort, search, filter, and edit. Two complete parallel workflows built to compensate
- CMs carrying notebooks to PD visits — writing questions before, transcribing after. Standard practice. Nobody named it as a problem
- OPS handling tasks that belonged with the RM — accumulated in their bucket with no process behind it
- Employees discussing top performers informally, but no self-service view of their own performance data
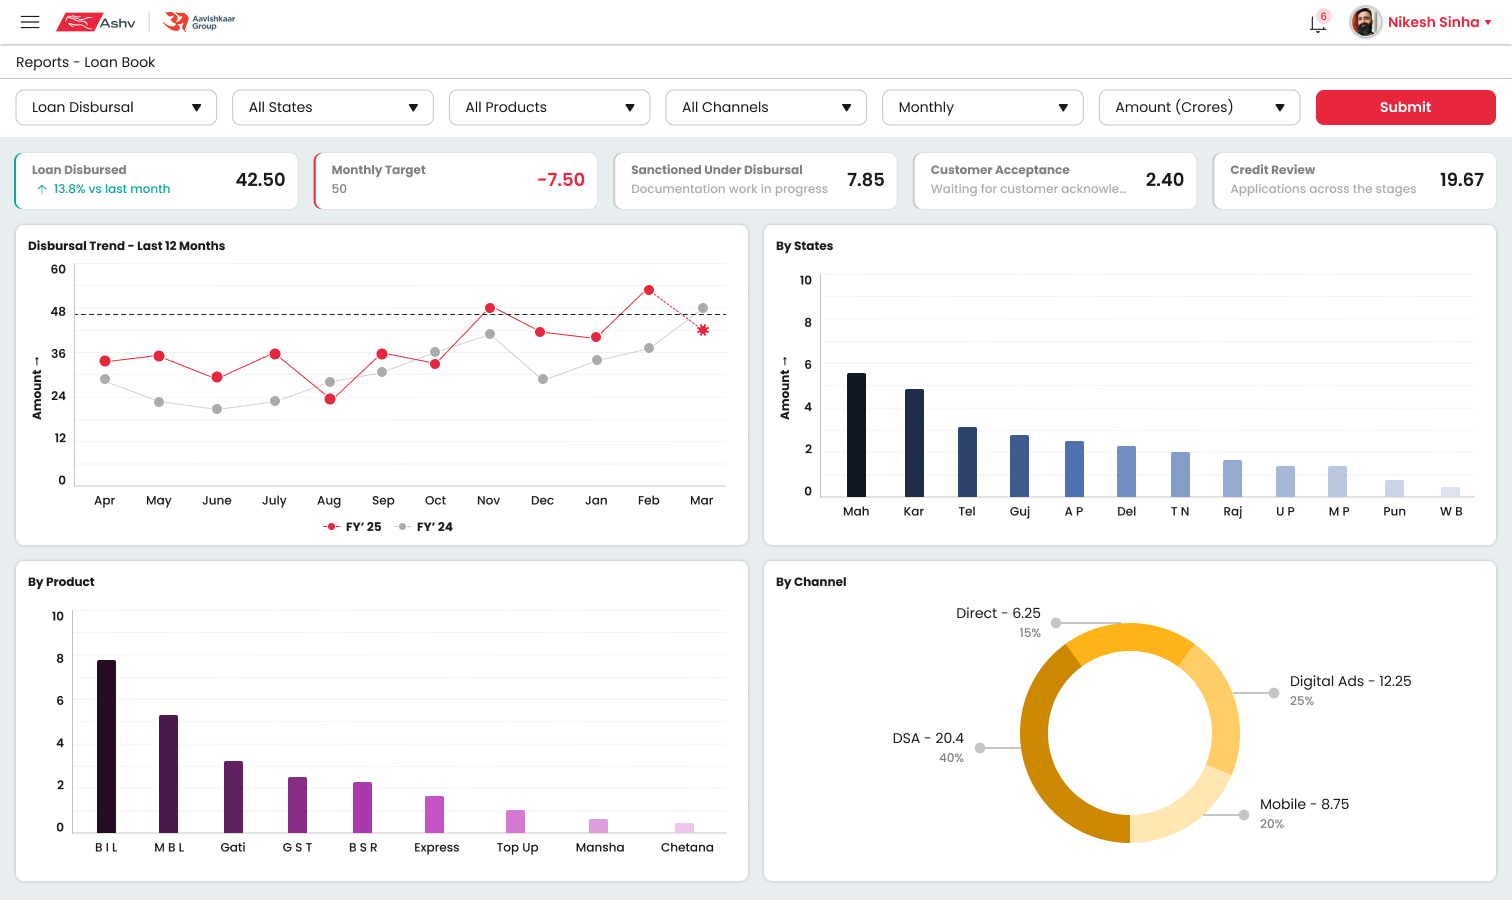
- System slowness at month-end: 30–45 min page loads. Consistent across every branch

3.5 — Stakeholder Interviews
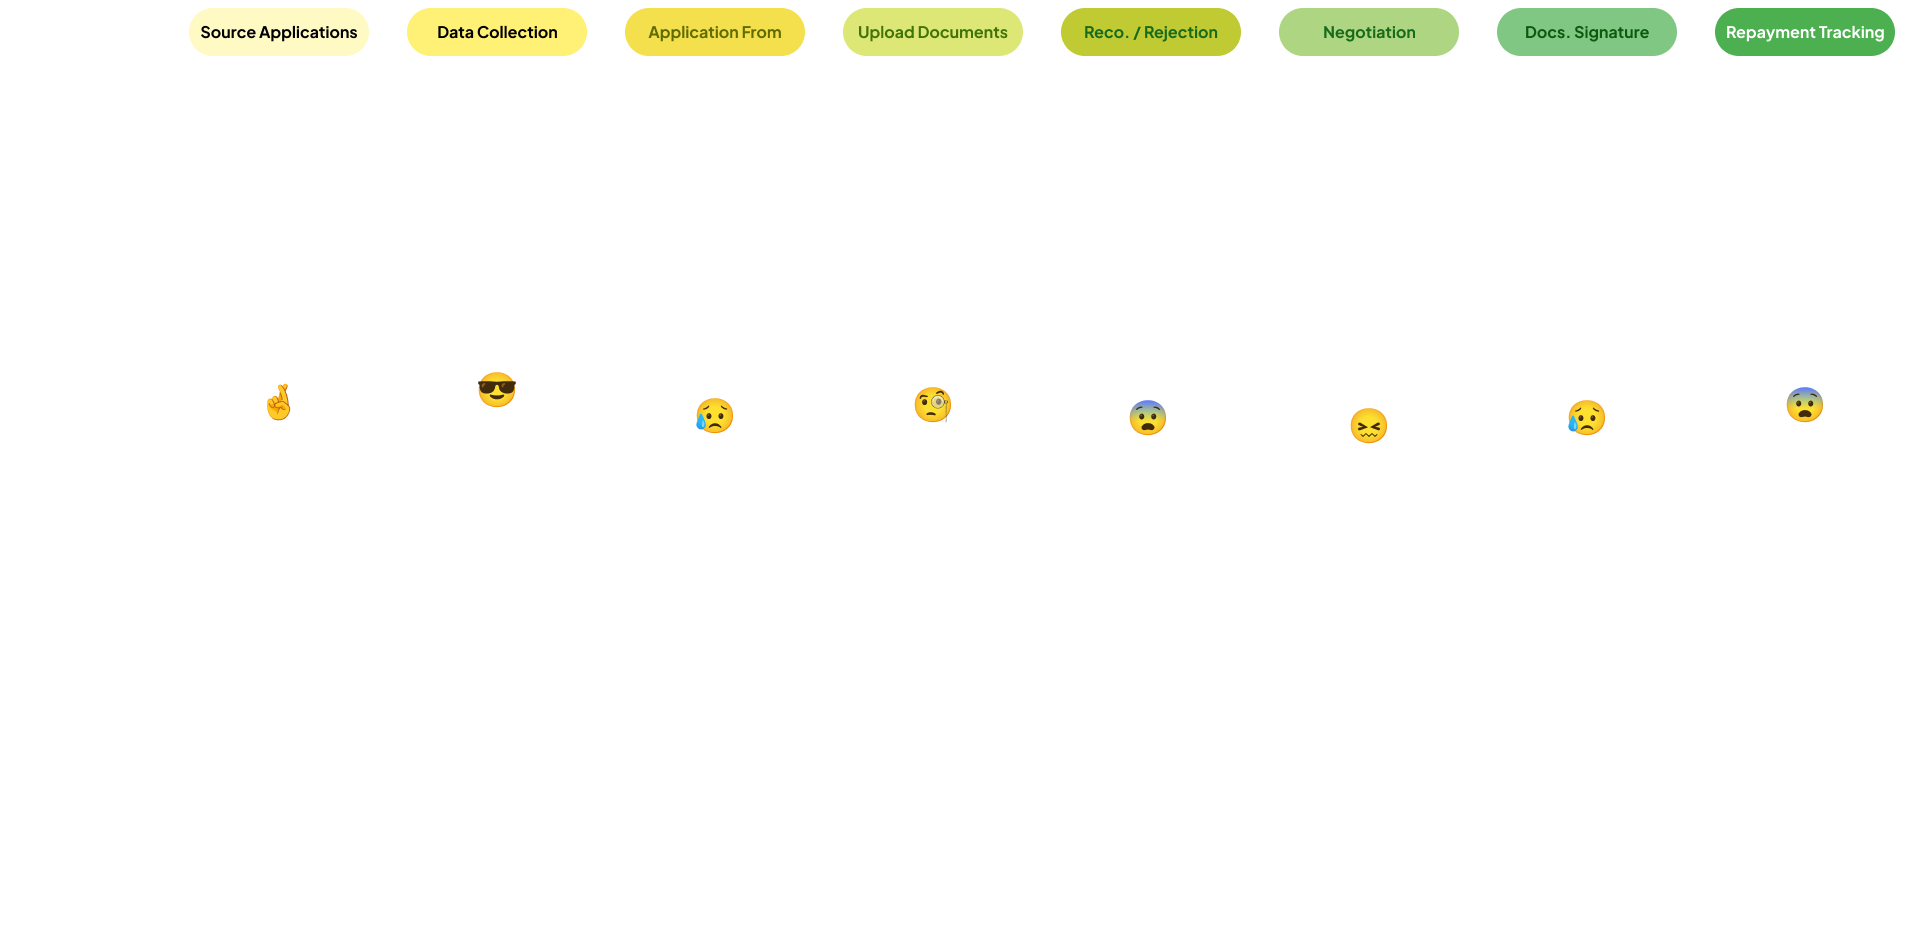
3.7 — Primary Customer Research
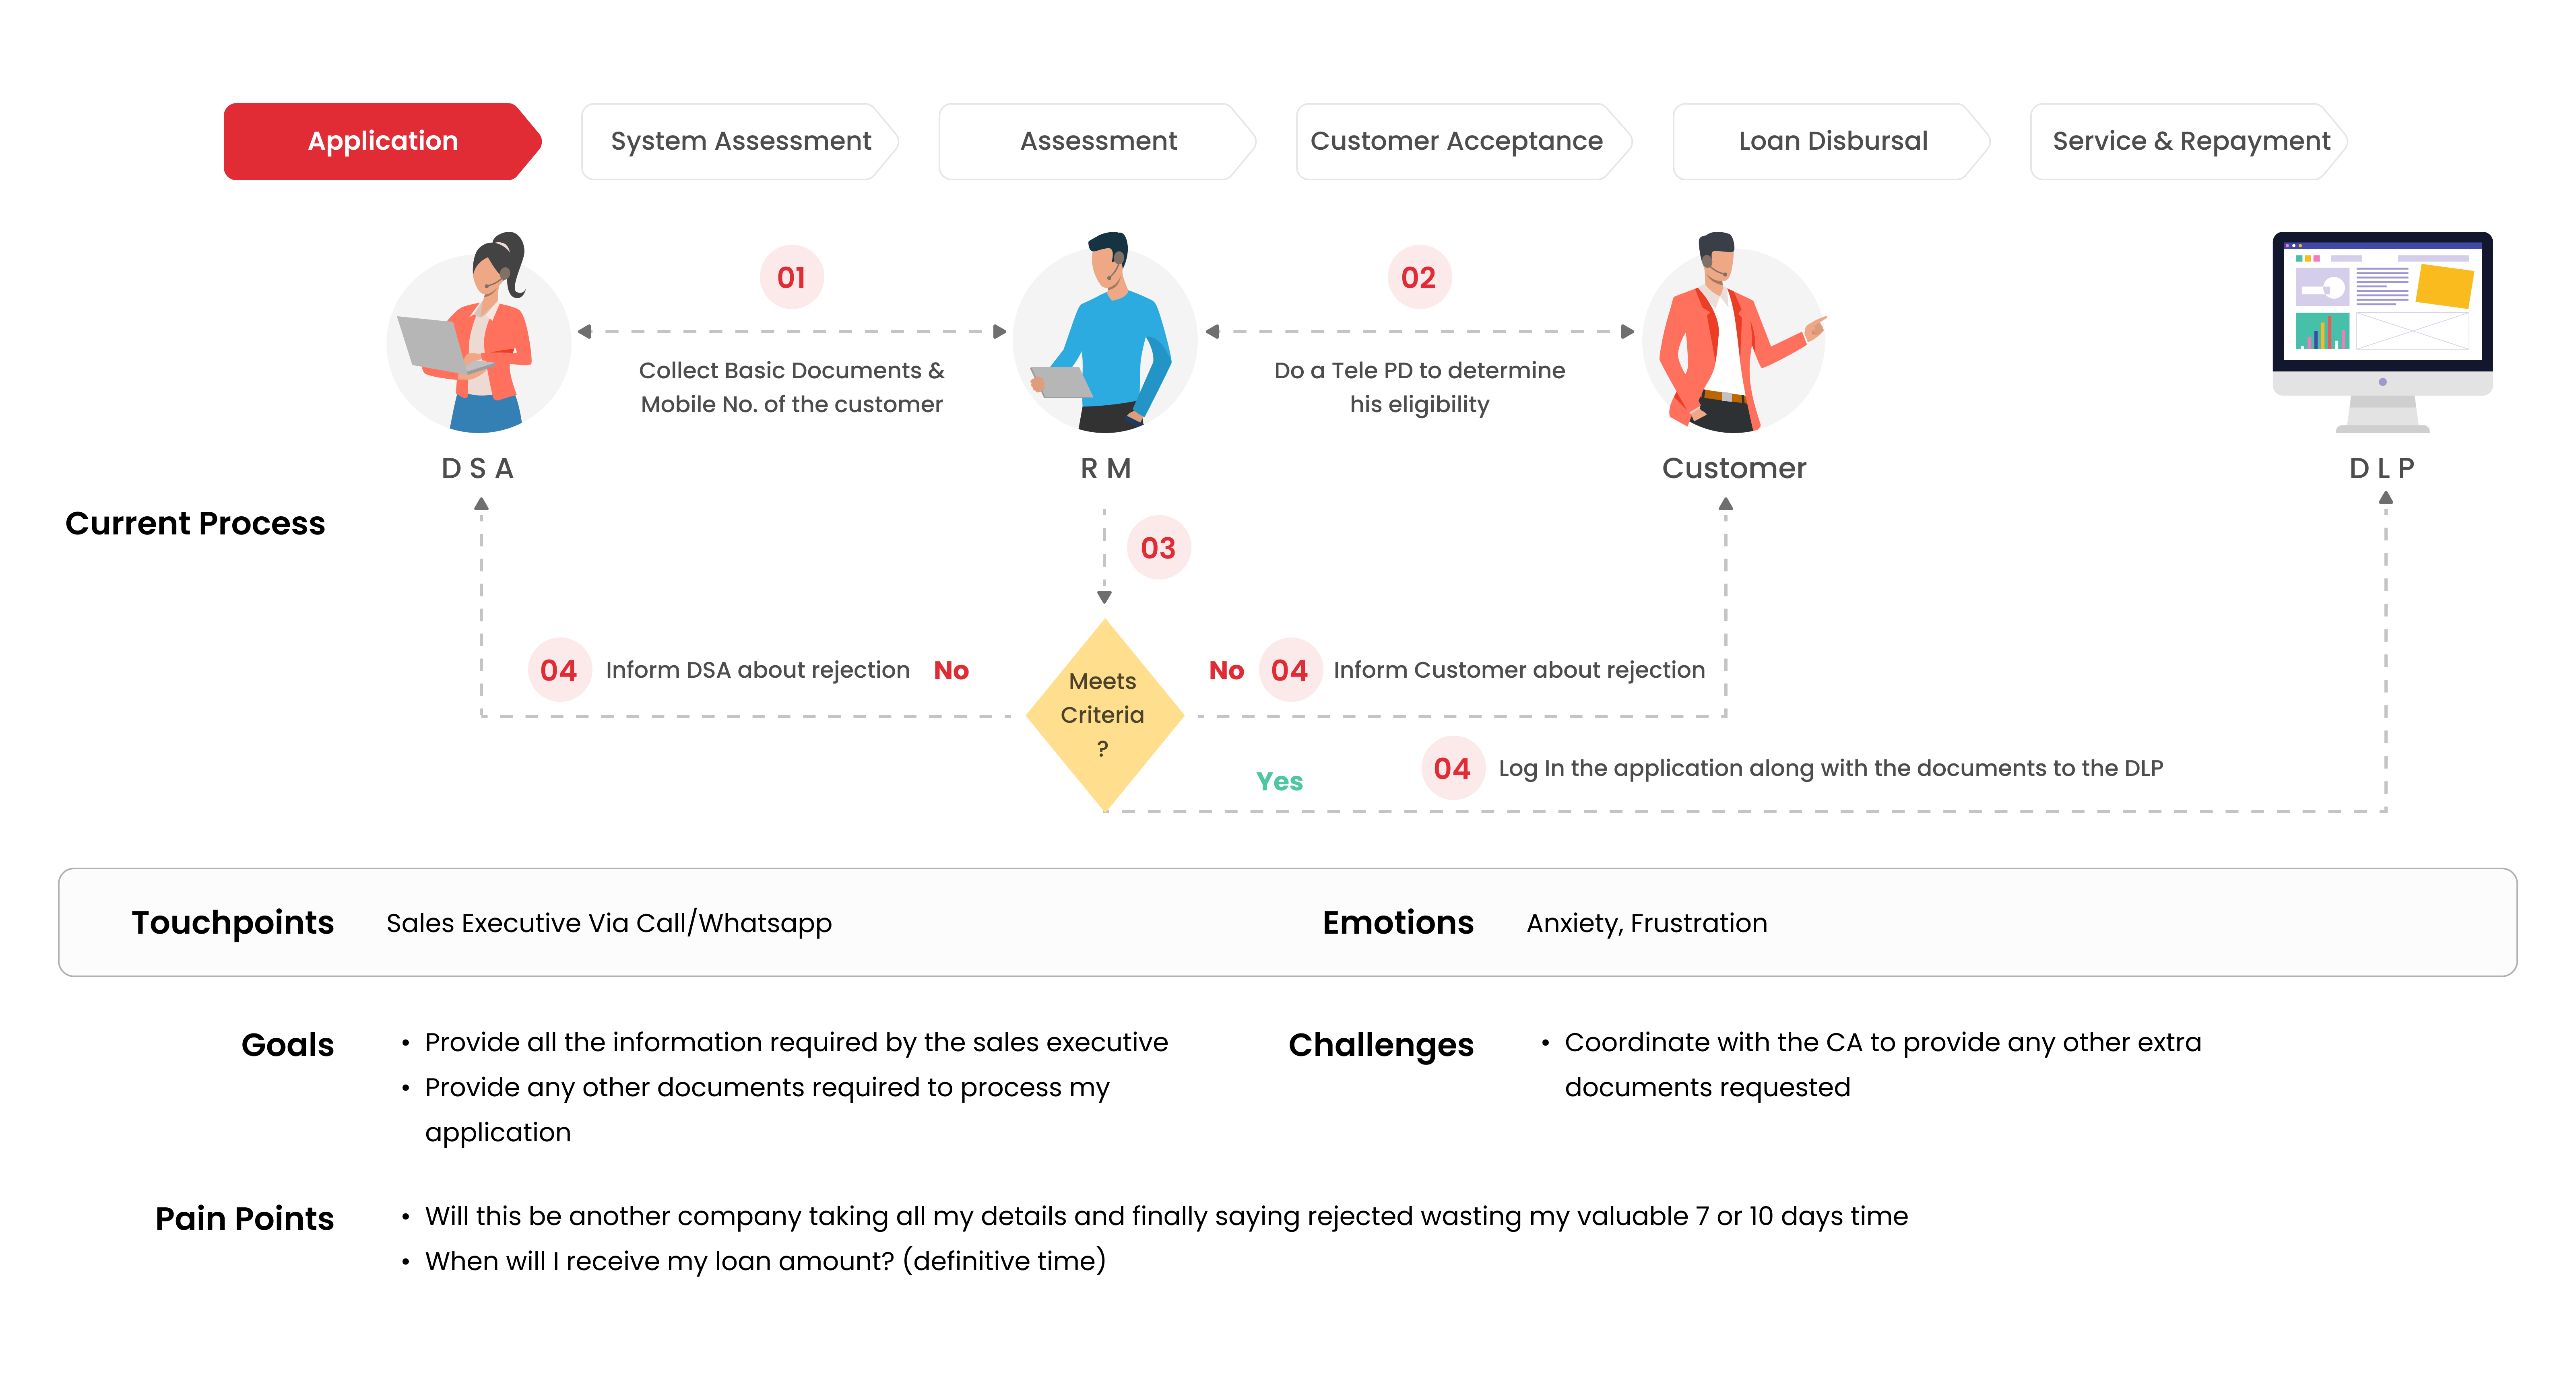
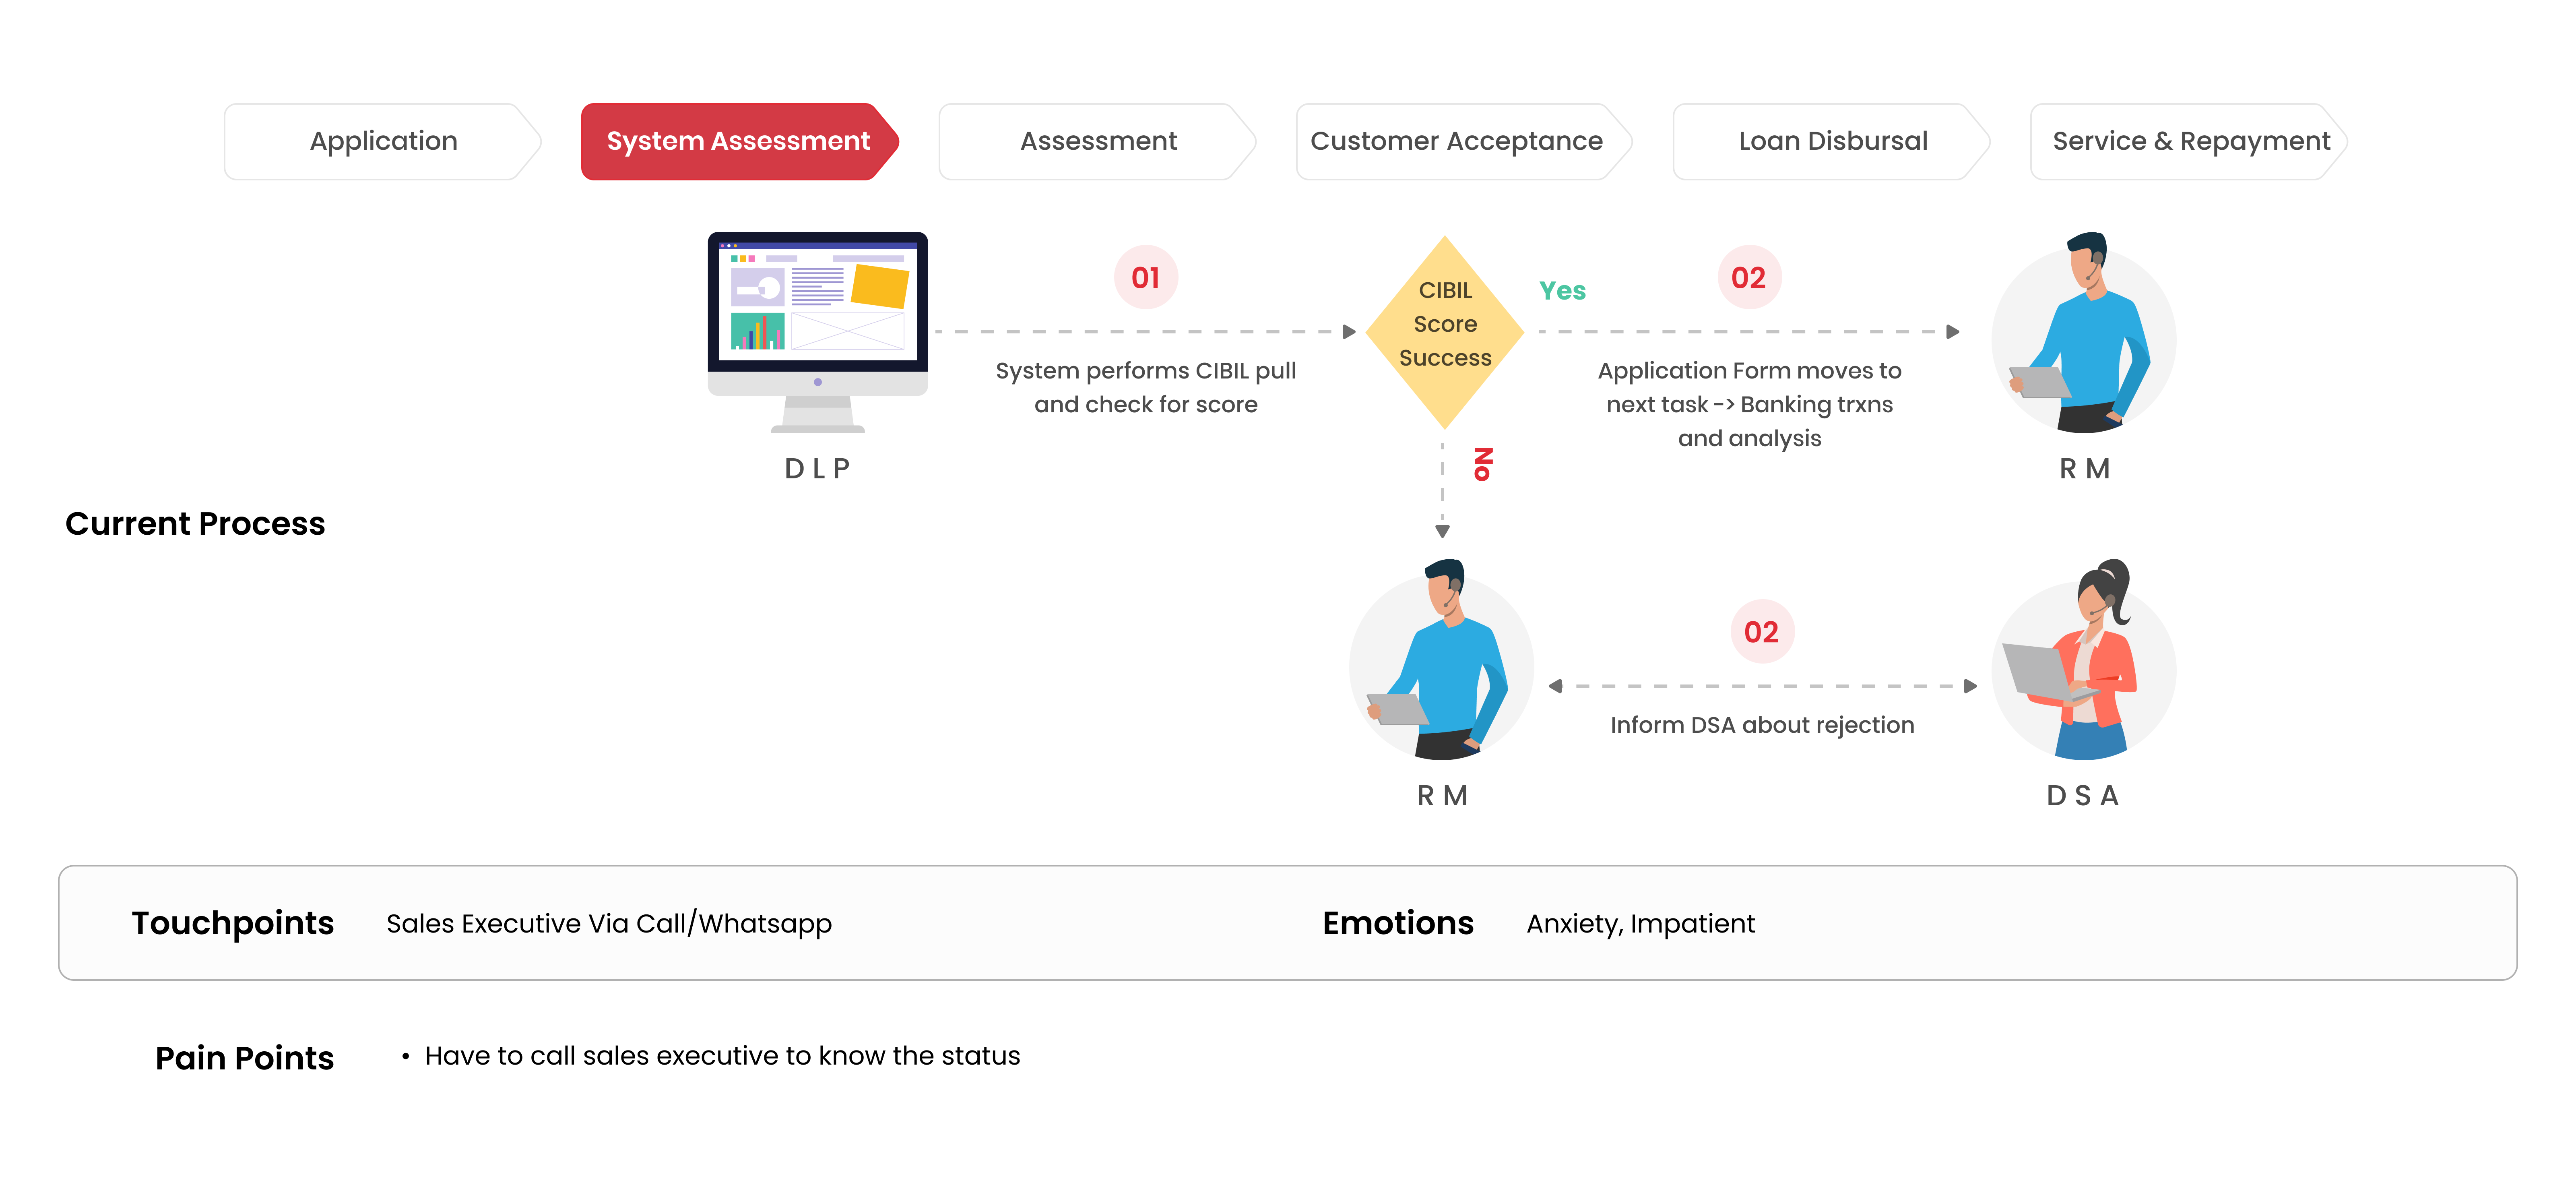
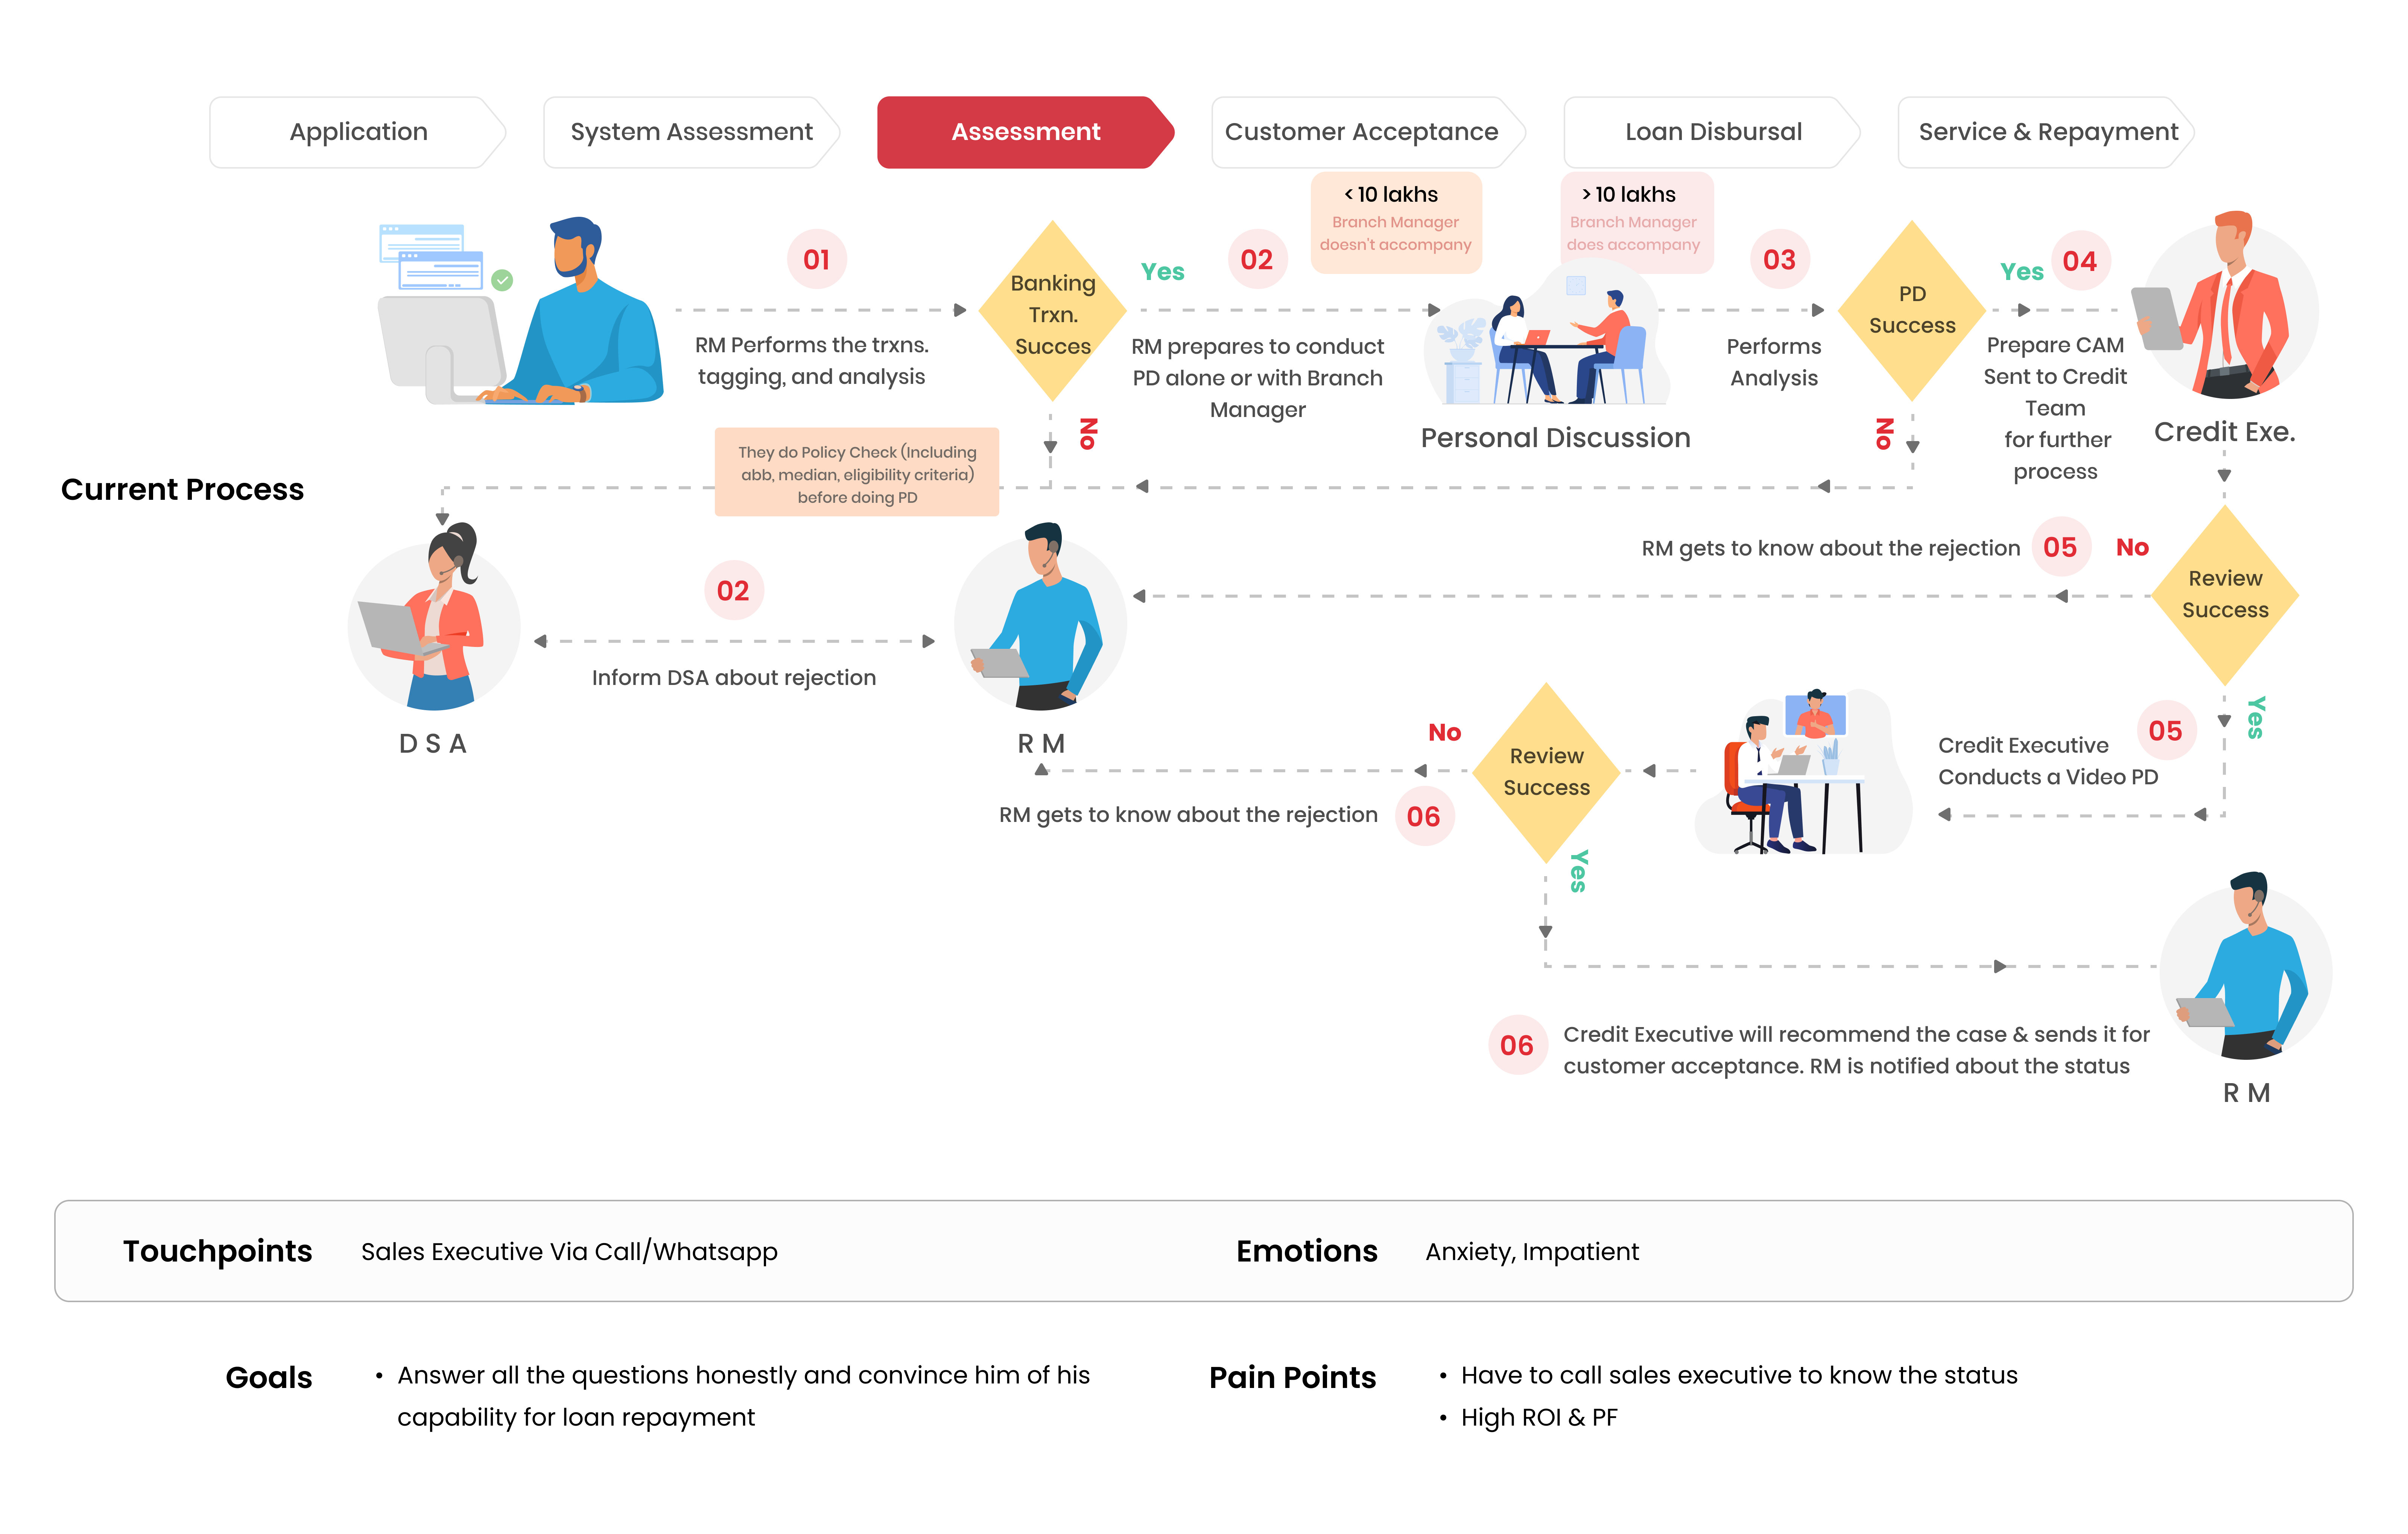
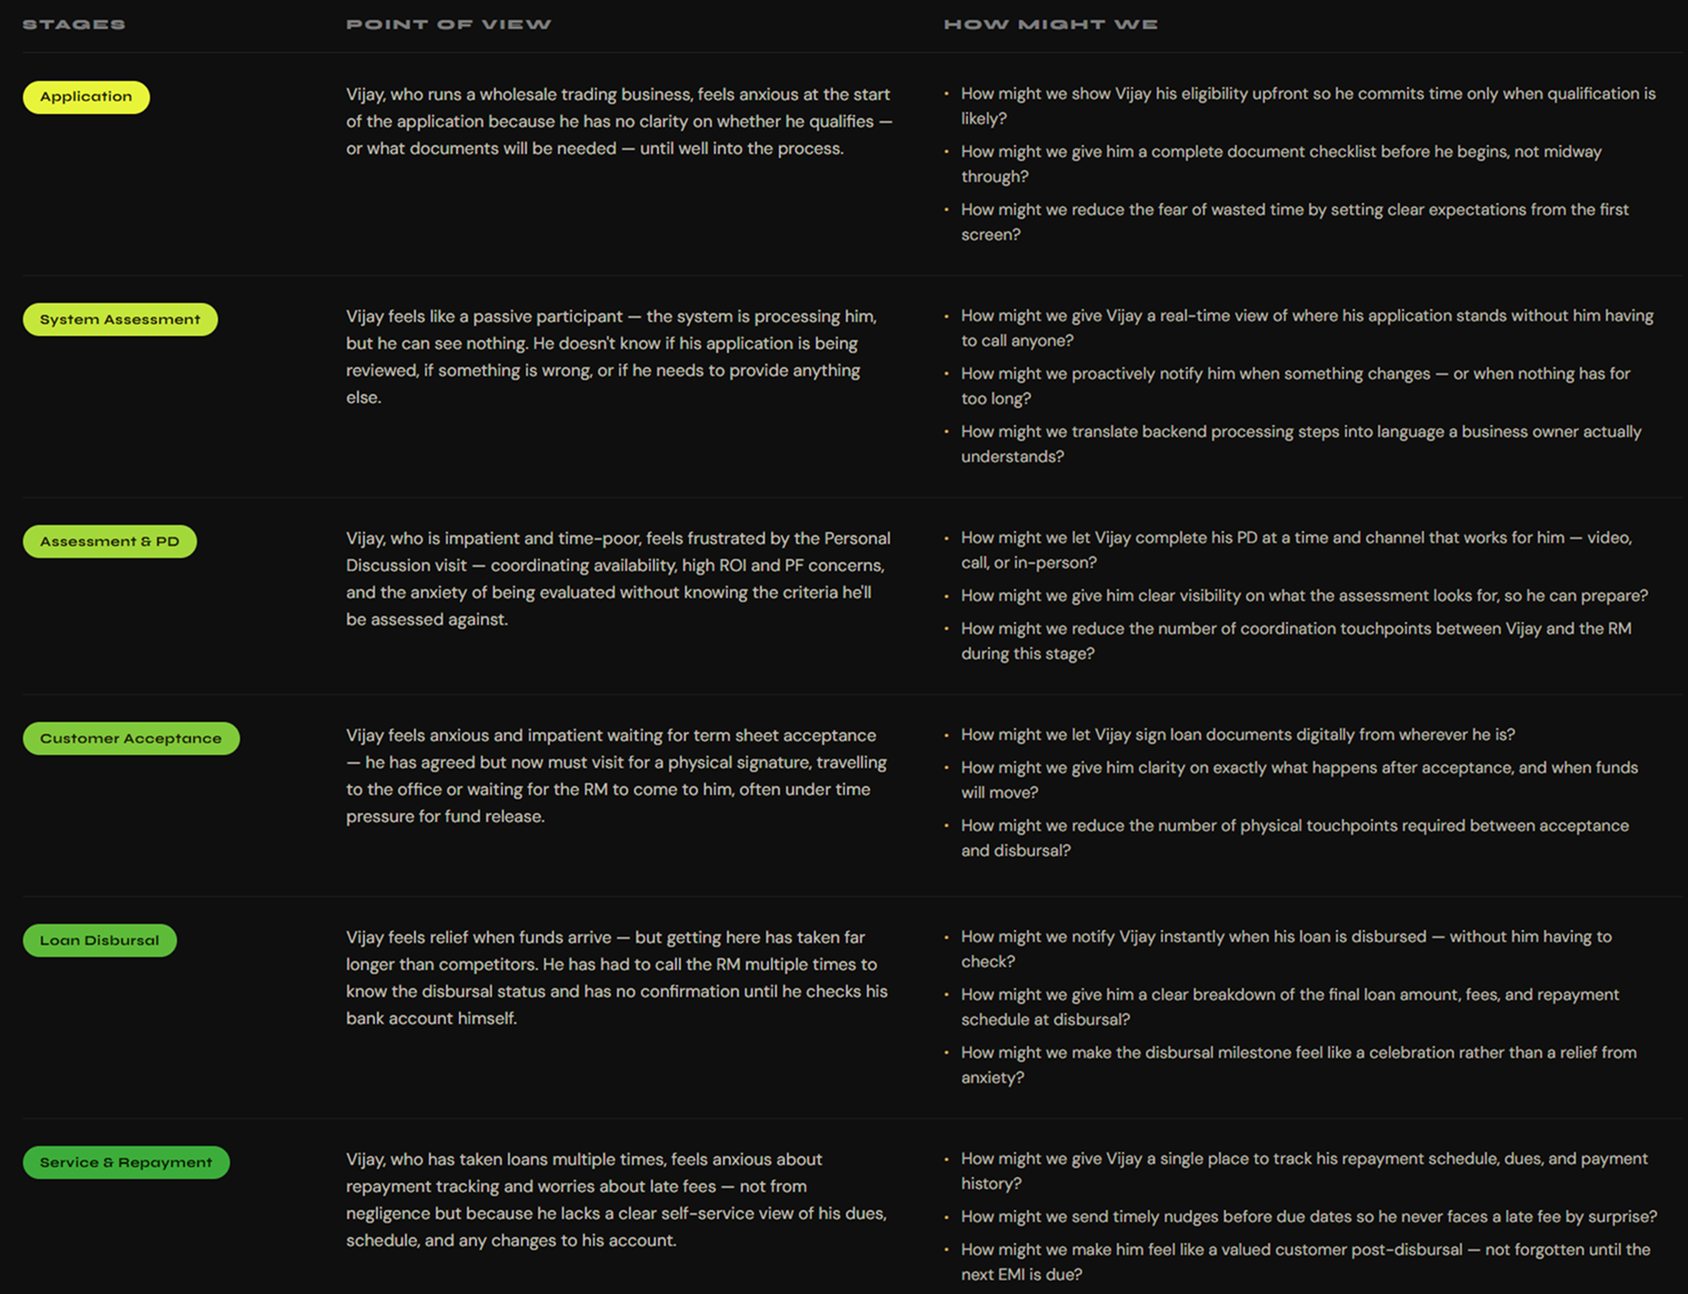
 I should know at the starting itself whether I am eligible or not. So that I can look for arranging my financial needs elsewhere (Informal Market).
You invest a lot of time providing documents and answering every clarification required and wait for weeks togther to be informed that my application is rejected.
From Kotak it just took 5 days to get my last Business Loan disbursed.
Even if it gets debited it doesn't reflect — and I'm being charged late fees. Am I responsible?
I should know at the starting itself whether I am eligible or not. So that I can look for arranging my financial needs elsewhere (Informal Market).
You invest a lot of time providing documents and answering every clarification required and wait for weeks togther to be informed that my application is rejected.
From Kotak it just took 5 days to get my last Business Loan disbursed.
Even if it gets debited it doesn't reflect — and I'm being charged late fees. Am I responsible?
3.8 — How the findings were processed - 4 Steps applied after every research phase
3.8.1 — Root Cause Classification
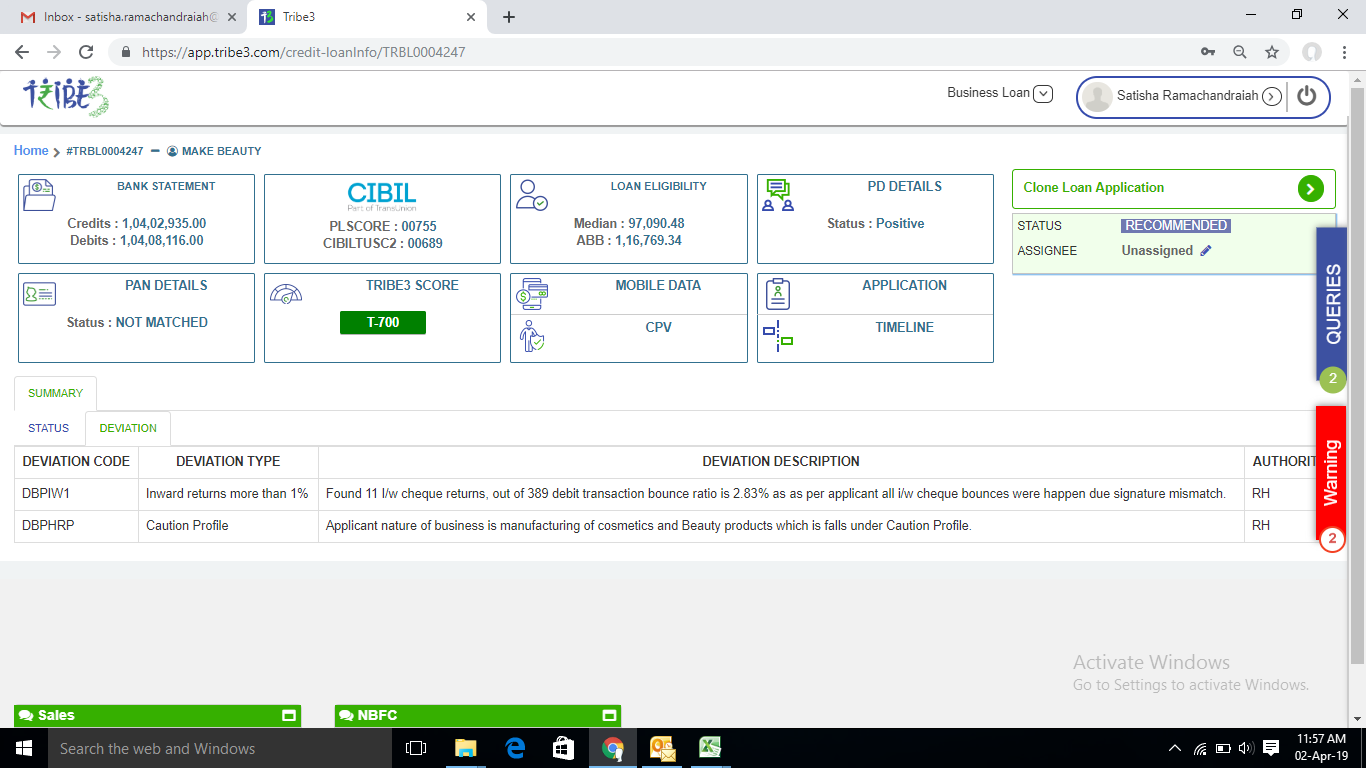
Design fixed it - Error Diagnosis, and Recovery guidance built into the interface — reduced bank statement upload tickets by 70% in the first month alone.
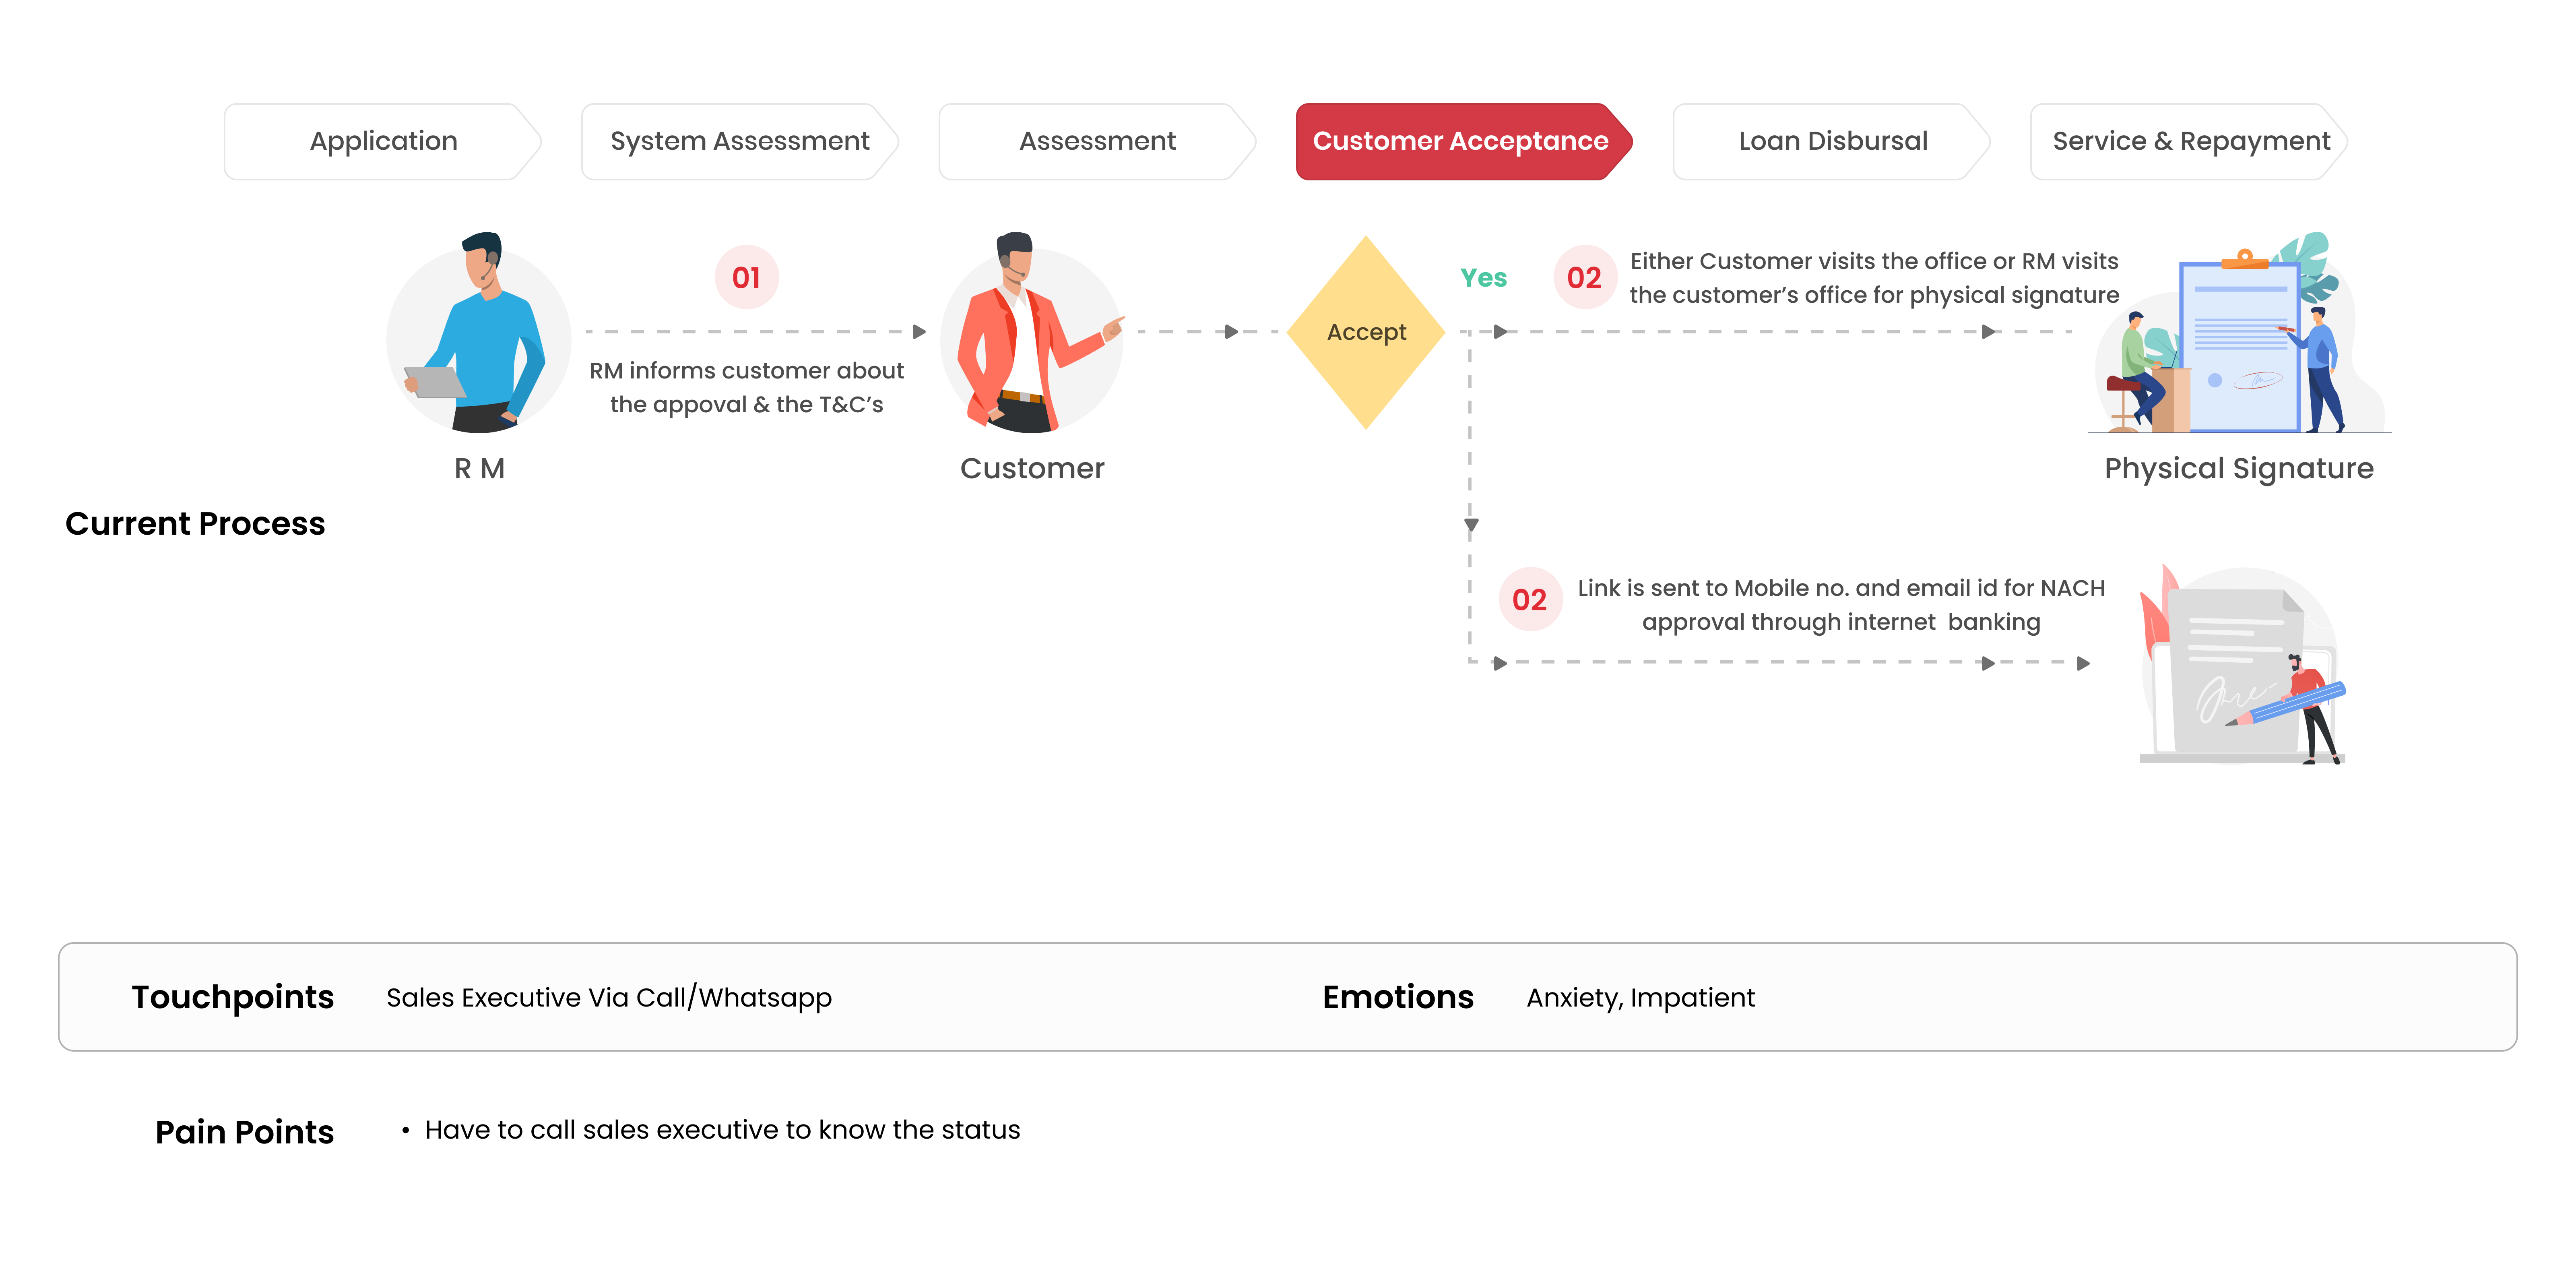
Solution: e-sign (digital equivalent) — accommodated the mandate while eliminating the travel.
Required a structural process change - real-time TAT attribution per department in the dashboard.
Solution - Recovery-first design (CM flag interface) and a pattern-submission interface so CMs could raise ticket with the right person
How Did We Classify ? - The Answer - 5 WHY'S
Ticket Analysis
Usability testing + UX Challenges 10.7% tickets
Heuristic evaluation — H9, ticket data
Ethnography: "I just raise a ticket when it doesn't work".
Ticket Analysis — Surfaced what interviews couldn't
3.8.2 — Thematic Analysis
or when a stage fails
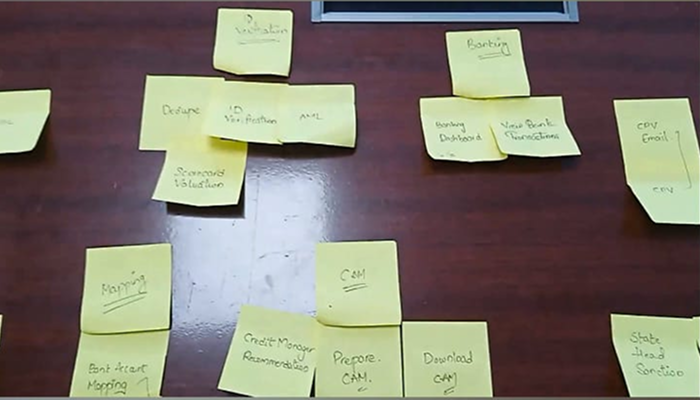
3.8.3 — Affinity Mapping
fault
across five different channels
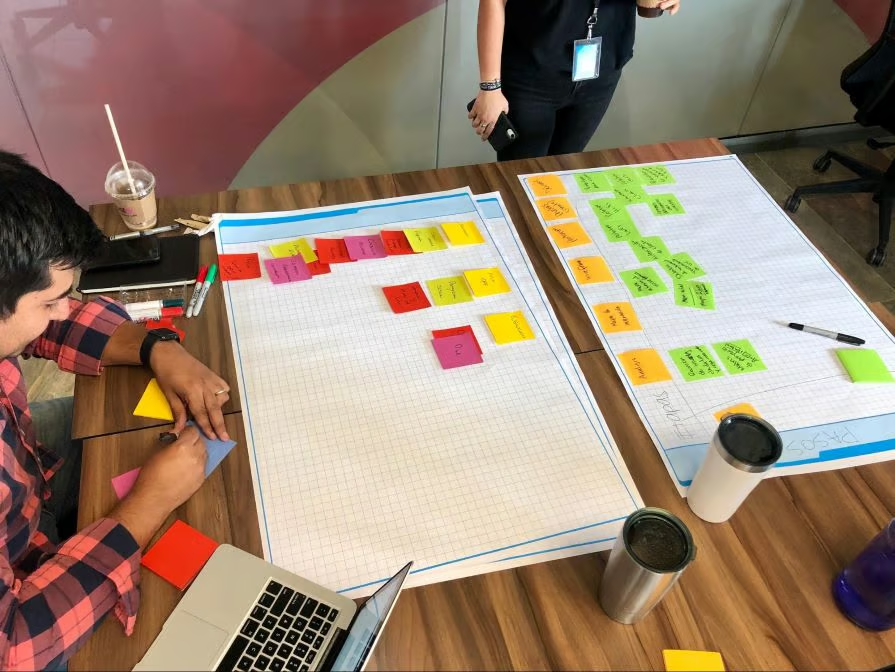
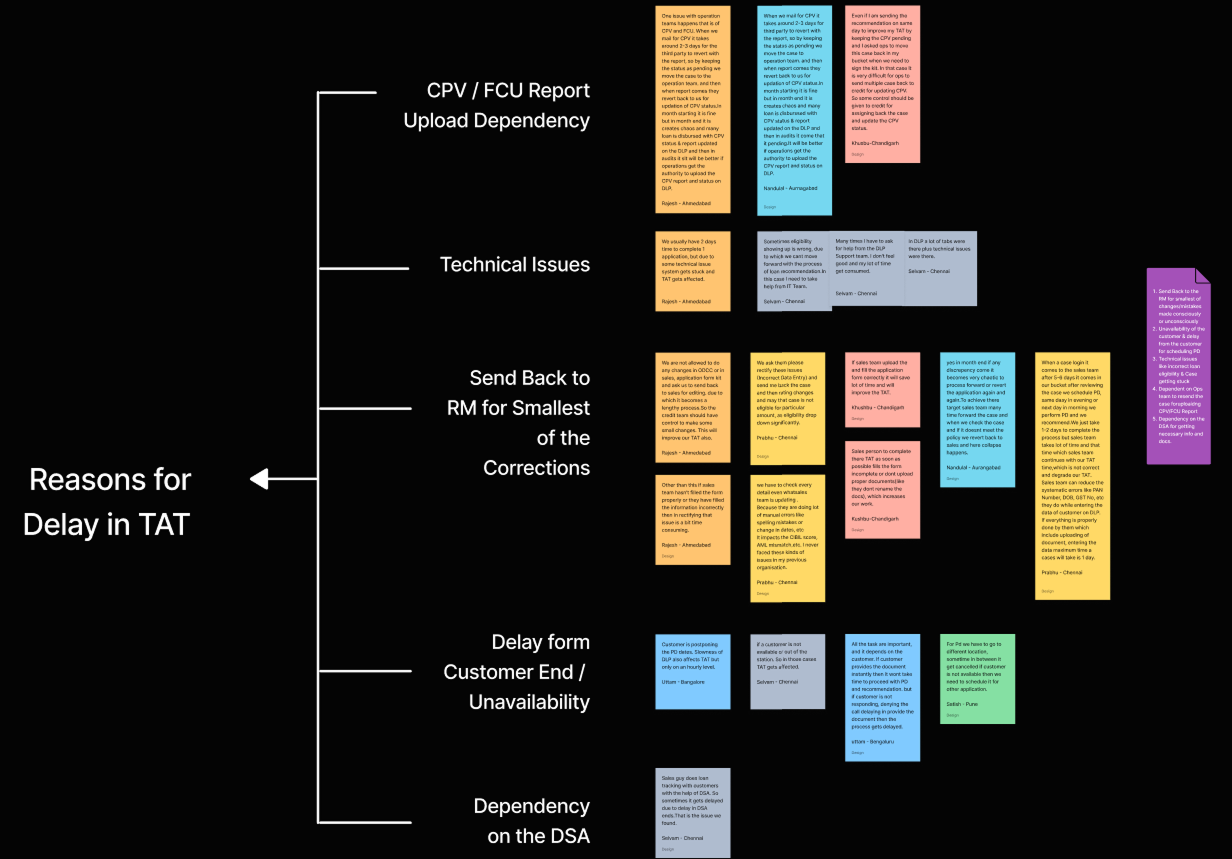
The absence of a system answer created a human workaround at every level.
and context disappeared. Digitising the steps would have digitised the delay — not eliminated it.